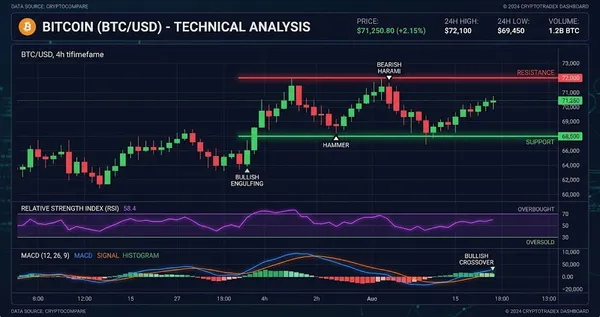
Bitcoin (BTC) Interactive Chart Analysis — August 9, 2026
BTC at $64,830 — interactive chart with EMA, BB, RSI, MACD, S/R levels. WEAK bullish signal (20). Funding rate 0.0062%.
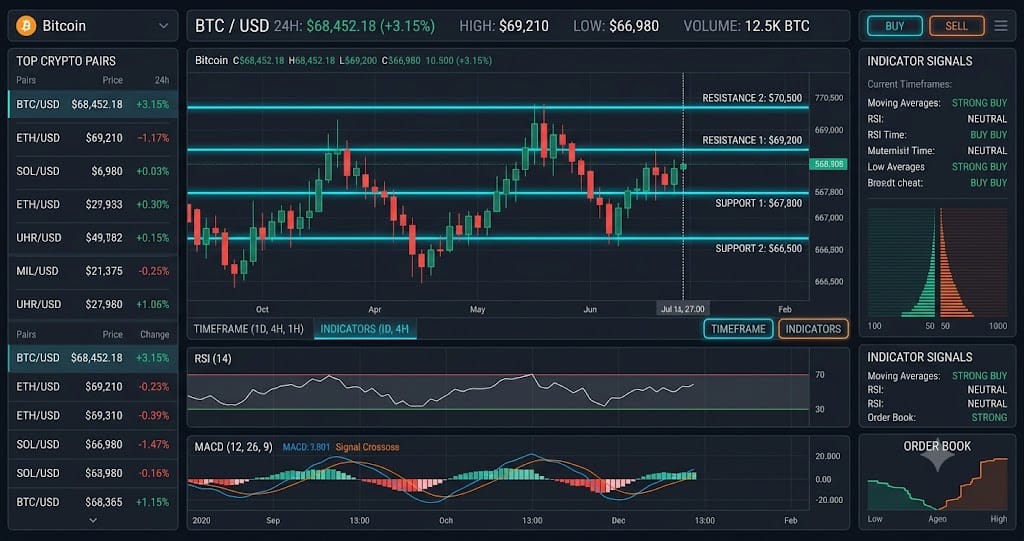
Interactive chart — switch timeframes, toggle indicators, hover for OHLC data
Market Structure
As of August 9, 2026, BTC trades at $64,830, above EMA20 at $64,380 and EMA50 at $64,667, giving the structure a weak bullish bias. RSI at 54.0 and BB %B at 61.1% support moderate momentum, while resistance at $65,514 limits immediate upside according to the supplied BTC indicator data.
Key Levels
| Price | Type | Source | Significance | Distance |
|---|---|---|---|---|
| $73,008 | Resistance | EMA200 | High | +12.6% |
| $67,014 | Resistance | Pivot R3 | Low | +3.4% |
| $66,197 | Resistance | Pivot R2 | Medium | +2.1% |
| $65,514 | Resistance | Pivot R1 | Medium | +1.1% |
| $64,830 | Current | — | — | — |
| $64,667 | Support | EMA50 | Medium | -0.3% |
| $64,014 | Support | Pivot S1 | Medium | -1.3% |
| $63,197 | Support | Pivot S2 | Medium | -2.5% |
| $62,513 | Support | Pivot S3 | Low | -3.6% |
Moving Averages
| MA | Value | Position | Signal |
|---|---|---|---|
| EMA 20 | $64,380 | Above | Bullish |
| EMA 50 | $64,667 | Above | Bullish |
| EMA 200 | $73,008 | Below | Bearish |
| BB Middle (SMA 20) | $64,419 | Above | Bullish |
Volume Analysis
As of August 9, 2026, BTC volume is only 0.19x average, showing that the current move lacks strong participation according to the supplied BTC indicator data. This confirms that a breakout above $65,514 needs higher volume to validate continuation; without that increase, the $64,667-$65,514 range remains the stronger near-term structure.
Technical Indicators
Trade Setup
Scenario Analysis
Bullish Case
Trigger: BTC breaks and holds above $65,514
Target: $66,829
Invalidation: $64,667
As of August 9, 2026, BTC at $64,830 has RSI 54.0 and a positive MACD histogram, supporting a move toward $66,829 if $65,514 breaks. The 0.19x volume ratio is the key confirmation requirement, so a breakout without volume expansion would weaken this scenario according to the supplied BTC indicator data.
Base Case
Trigger: BTC breaks and holds above $65,514
Target: $66,829
Invalidation: $64,667
As of August 9, 2026, BTC at $64,830 has RSI 54.0 and a positive MACD histogram, supporting a move toward $66,829 if $65,514 breaks. The 0.19x volume ratio is the key confirmation requirement, so a breakout without volume expansion would weaken this scenario according to the supplied BTC indicator data.
Bearish Case
Trigger: N/A
Target: N/A
Invalidation: N/A
Analysis Summary
Bitcoin (BTC) Resources