
Bitcoin (BTC) Interactive Chart Analysis — August 30, 2026
BTC at $78,103 — interactive chart with EMA, BB, RSI, MACD, S/R levels. WEAK bullish signal (25). Funding rate 0.0100%.
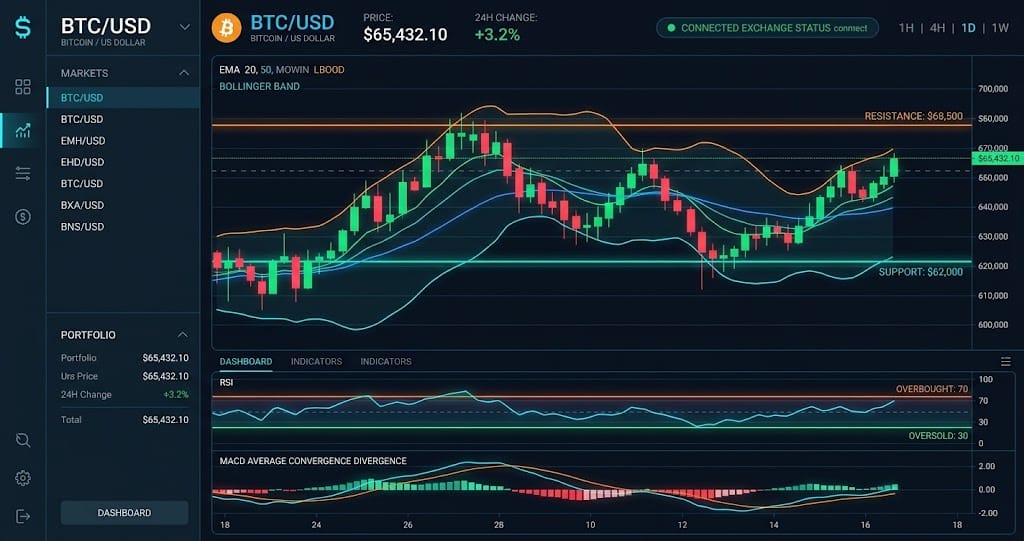
Interactive chart — switch timeframes, toggle indicators, hover for OHLC data
Market Structure
BTC trades at $78,103, with a WEAK bullish signal of 25 and RSI at 70.8, according to the supplied technical data as of August 30, 2026. Price remains above EMA20 at $73,296 and EMA50 at $69,288, while the Hammer pattern supports the broader uptrend. The immediate structure is bullish, but RSI above 70 raises the risk of a pullback toward $76,175.
Key Levels
| Price | Type | Source | Significance | Distance |
|---|---|---|---|---|
| $85,305 | Resistance | Pivot R3 | Low | +9.2% |
| $83,378 | Resistance | Pivot R2 | Medium | +6.8% |
| $80,740 | Resistance | Pivot R1 | Medium | +3.4% |
| $78,103 | Current | — | — | — |
| $76,175 | Support | Pivot S1 | Medium | -2.5% |
| $74,248 | Support | Pivot S2 | Medium | -4.9% |
| $73,296 | Support | EMA20 | Low | -6.2% |
| $71,610 | Support | Pivot S3 | Low | -8.3% |
Moving Averages
| MA | Value | Position | Signal |
|---|---|---|---|
| EMA 20 | $73,296 | Above | Bullish |
| EMA 50 | $69,288 | Above | Bullish |
| EMA 200 | $71,898 | Above | Bullish |
| BB Middle (SMA 20) | $71,617 | Above | Bullish |
Volume Analysis
Volume is only 0.24x the average, according to the supplied August 30, 2026 data, which is weak confirmation for BTC's move toward $78,103. Open interest stands at 108,598 contracts and the long/short ratio is 2.06, while funding is 0.0100%, showing a strong long bias without strong volume participation. A move above $80,740 would therefore need higher volume to confirm continuation.
Technical Indicators
Trade Setup
Scenario Analysis
Bullish Case
Trigger: BTC closes above $80,740 with volume rising above 1.0x average
Target: $84,966
Invalidation: $76,175
BTC could extend the uptrend if $80,740 breaks with volume confirmation, with the $84,966 area becoming the next measured target based on the $2,113 ATR. The bullish setup remains valid above $76,175, while RSI at 70.8 means momentum is already stretched.
Base Case
Trigger: BTC holds $76,175 while failing to establish a sustained close above $80,740
Target: $76,175-$80,740
Invalidation: Daily close below $76,175
BTC is most likely to consolidate between $76,175 and $80,740 as low volume at 0.24x average limits directional confirmation. The 73.2% Bollinger %B reading and RSI of 70.8 support a cooling phase rather than an immediate trend acceleration.
Bearish Case
Trigger: BTC closes below $76,175, with selling volume rising above 1.0x average
Target: $73,296-$69,288
Invalidation: Close above $80,740
A break below $76,175 would weaken the current structure and expose EMA20 at $73,296, with EMA50 at $69,288 as the deeper downside level. The bearish case gains credibility if the 0.24x volume ratio expands during the decline, because current volume does not yet confirm heavy distribution.
Analysis Summary
Bitcoin (BTC) Resources