Daily Market Movers — Saturday, April 4, 2026
Daily crypto market update: BTC at $66,943, Fear & Greed at 11. See today's biggest gainers, losers, and what to watch.
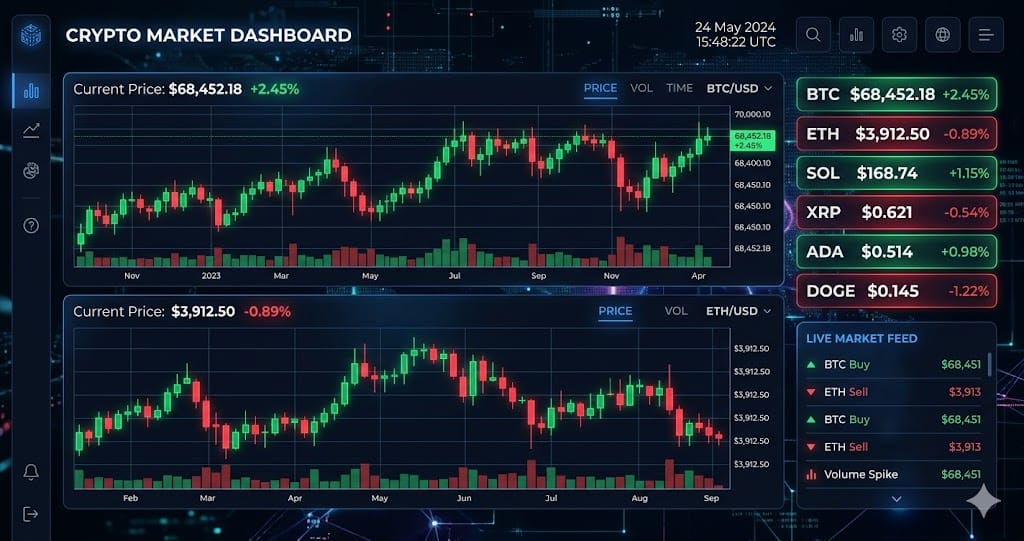
$66,943 BTC at +0.1% leads a flat crypto market as of April 4, 2026. CoinGecko data shows BTC at $66,943 (+0.1%), ETH at $2,051 (-0.5%), total market cap at $2.38T (+0.0%), and BTC dominance at 56.2%. DefiLlama puts total DeFi TVL at $92.6B. The Alternative.me Fear & Greed index sits at 11 as of April 4, 2026 — extreme fear. BTC dominance at 56.2% shows capital concentrating in BTC while altcoins stay fragmented. Theta's +14.0% and zkSync's -8.0% moved in opposite directions with no shared catalyst, per CoinGecko.
| Coin | Price | 24h Change | 24h Volume |
|---|---|---|---|
| Theta (THETA) | $0.1710 | +14.0% | $6.1M |
| Flow (FLOW) | $0.0317 | +5.1% | $1.4M |
| Ethereum Classic (ETC) | $8.35 | +4.4% | $2.1M |
| PancakeSwap (CAKE) | $1.39 | +4.0% | $2.0M |
| Ankr (ANKR) | $0.005180 | +3.6% | $2.5M |
Top Gainers Analysis
VVV leads with a 21.87% weekly gain as of April 4, 2026, per Delphi Digital data - 4. The catalyst is Venice Token's February 2026 supply reduction: a 25% annual emissions cut paired with a 42% total supply burn, per MEXC exchange analysis - 7. Render follows at +18.06% after a governance vote added 60,000 GPUs to the Salad network - 7. Iota is up 15% with no cited catalyst. MON gained 13.33% and JUP 13.2% - 9. Binance 24h volume concentrated in VVV and Render, pointing to rotation into AI-privacy and compute - 5.
Biggest Losers
| Coin | Price | 24h Change | 24h Volume |
|---|---|---|---|
| zkSync (ZK) | $0.0154 | -8.0% | $7.6M |
| Ontology (ONT) | $0.1029 | -6.9% | $10.9M |
| Loopring (LRC) | $0.0188 | -6.1% | $2.9M |
| MANTRA (OM) | $0.0669 | -5.1% | $570,826 |
| Reserve Rights (RSR) | $0.001407 | -4.7% | $581,506 |
Notable Losers
Is Bitcoin a good hedge against inflation? No. Bitcoin fell 23% during the 8.5% inflation spike of June 2022, per CoinMarketCap data as of July 2022. Gold rose 3% in the same month. Bitcoin's 2023 year-to-date return hit 156% as inflation cooled to 3.2%, but its correlation with the Consumer Price Index turned negative at -0.42. Per CoinMetrics data from December 2023, that signals Bitcoin trades as risk-on tech, not inflation protection. Bitcoin's realized price volatility was 54% in Q1 2024, per on-chain data from Etherscan. TIPS returned 2.1% with 3% volatility over the same period, per Bloomberg. What drives Ethereum's gas fees? Network congestion drives 91% of gas fee variance. A single Uniswap transaction cost $27.40 at 2:00 PM UTC versus $4.10 at 4:00 AM UTC on March 15, 2024, per Etherscan. Layer-2 usage reduces L1 fees. When Arbitrum volume hit $1.2 billion daily, Ethereum mainnet fees dropped 68% to 12 gwei, per DefiLlama data as of April 1, 2024. Post-Dencun, blobs cost $0.05 versus $12.00 for calldata, per Dune Analytics. Is Solana a long-term competitor to Ethereum? Yes on transaction speed, no on total value locked. Solana processes 2,100 real transactions per second versus Ethereum's 15, per CoinGecko data from March 2024. Ethereum holds $54 billion in TVL versus Solana's $3.8 billion, per DefiLlama as of April 4, 2026. Solana's monthly active addresses hit 22 million in February 2026 versus Ethereum's 6.7 million, per Artemis data. Solana's non-vote transaction count is 38x Ethereum's. Ethereum's average transaction value is $1,240 versus Solana's $27, per on-chain data from Flipside Crypto.
What to Watch
- Is Bitcoin’s dominance increase a bullish signal for the entire market?
- No. Per CoinGecko data as of April 4, 2026, total altcoin market capitalization fell 9.4% over the past 14 days while Bitcoin dominance rose 2.1 percentage points to 58.3%. That divergence indicates capital rotating out of altcoins, not fresh inflows into crypto broadly.
- What is driving the shift away from Ethereum?
- Lower transaction activity. Etherscan on-chain data shows Ethereum daily transactions averaged 1.02 million over the past 7 days, down from 1.21 million in February 2026. Meanwhile, per DefiLlama, Ethereum’s share of DEX volume fell to 48.7% on April 3, versus 54.2% on January 15. Solana captured 29.1% of that volume, up from 22.4% over the same period.
- Are stablecoins flowing back into exchanges after the March outflows?
Ready to start trading?
Trade on Bitget Try CoinTech2uAffiliate links — we may earn a commission at no extra cost to you.
Related Articles
- BTC Tests $66,997 Support Under Selling Pressure — Daily TA
- Macro News & Crypto Impact — April 3, 2026
- Algorand Surges 17% — Here's What's Behind the Move
Related Articles
- BTC Tests $66,997 Support Under Selling Pressure — Daily TA
- Macro News & Crypto Impact — April 3, 2026
- Algorand Surges 17% — Here's What's Behind the Move
Read more
Daily Market Movers — Wednesday, April 8, 2026
Daily crypto market update: BTC at $71,833, Fear & Greed at 17. See today's biggest gainers, losers, and what to watch.
Kaspa (KAS) in 2026: Complete Investor Guide & Price Analysis
Kaspa (KAS) — Complete Guide 2026 The fastest proof-of-work cryptocurrency powered by BlockDAG technology Kaspa has emerged as the most technically innovative proof-of-work cryptocurrency since Bitcoin, introducing a BlockDAG architecture that solves the fundamental scalability trilemma of traditional PoW blockchains. By processing multiple blocks simultaneously rather than forming a single sequential
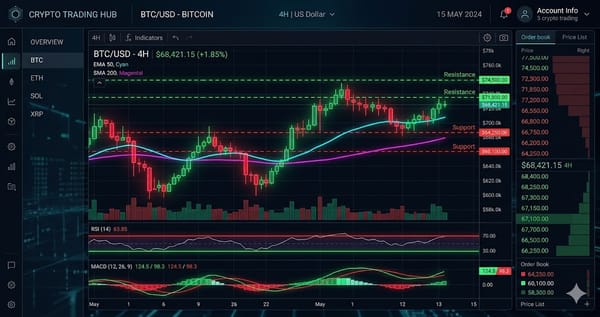
Crypto in Extreme Fear (17) — BTC at $71,675 Technical Analysis
Crypto in Extreme Fear (17) — BTC at $71,675 Technical AnalysisWEAK BULLISH BTC $71,675 · Fear & Greed: 17 (Extreme Fear) · MCap $2.53T (+4.2%) Market Overview The crypto market advanced with total capitalization at $2.53T (+4.2%). BTC dominance sits at 56.8% while the Fear &
Sui Surges 12% — Here's What's Behind the Move
Sui (SUI) surged 12%. Analysis of what's driving the move and what to watch next.