Crypto in Extreme Fear (8) — BTC at $69,164 Technical Analysis
Market Overview
The crypto market advanced with total capitalization at $2.45T (+2.4%). BTC dominance sits at 56.3% while the Fear & Greed Index reads 8 (Extreme Fear), reflecting cautious sentiment.
Bitcoin (BTC) — $69,164
▼ WEAK BEARISH (Score: -5)
Price Action & Key Levels
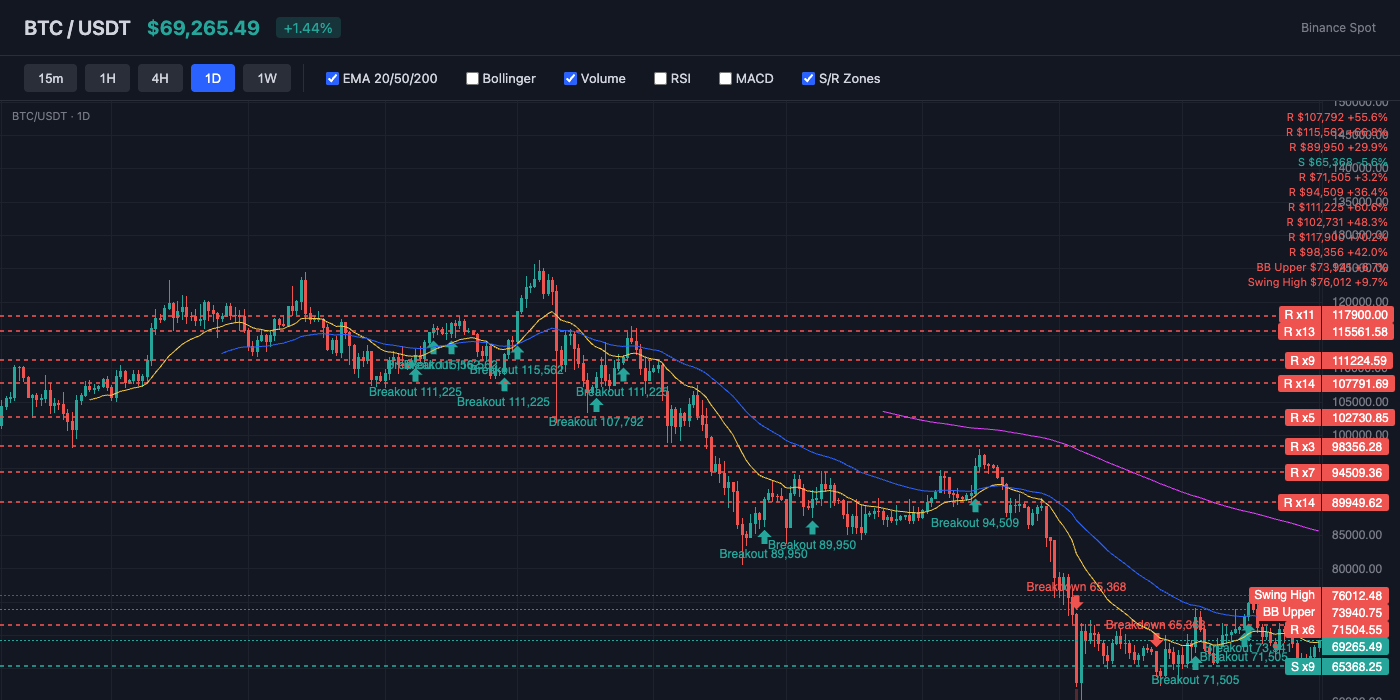
Bitcoin trades at $69,164, currently above the 20-day EMA ($68,941) and below the 50-day EMA ($71,073). The 200-day EMA at $87,195 serves as long-term resistance. Key resistance sits at $70,615 (Pivot R1), while support holds at $68,941 (EMA20). EMAs are stacked bearishly (20 < 50 < 200), indicating a sustained downtrend.
Bollinger Bands & Volatility
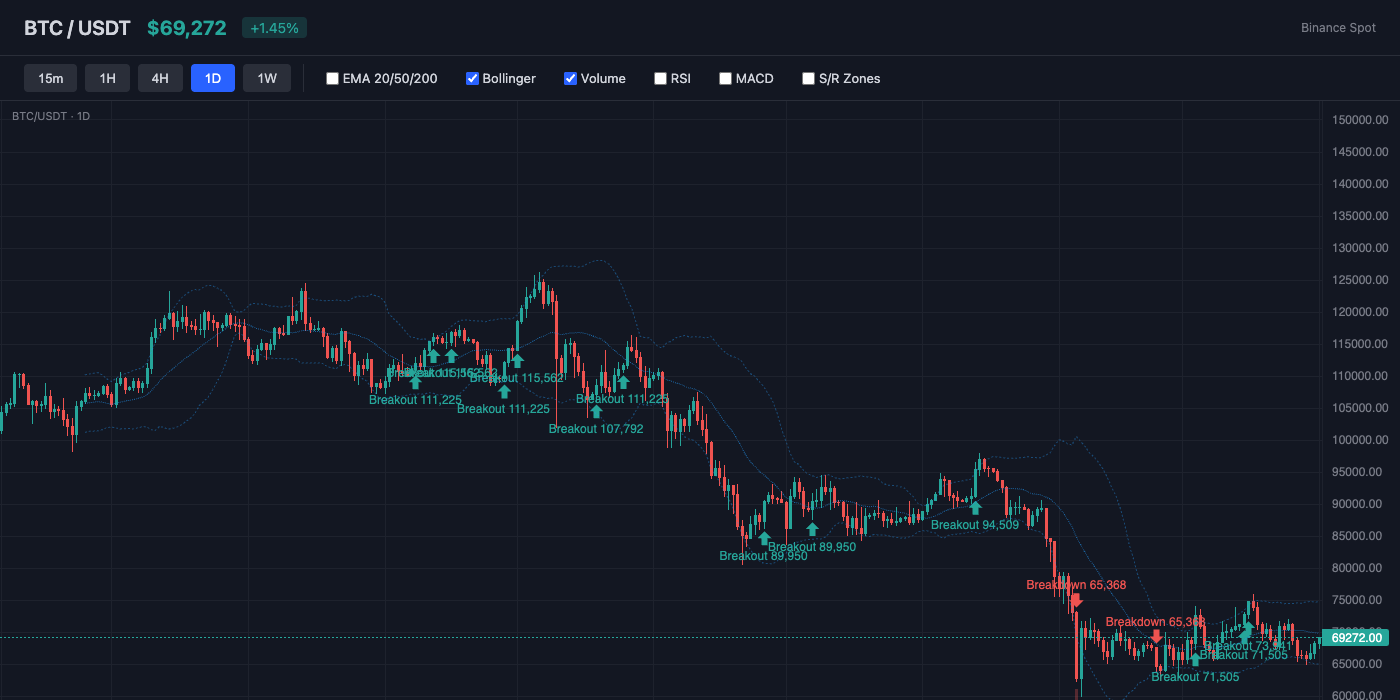
Bollinger Bands show a bandwidth of 12.1% (moderate volatility). Price is near the middle of the bands (%B: 43%), showing balanced positioning. The middle band (SMA 20) at $69,720 acts as dynamic resistance.
Momentum Indicators
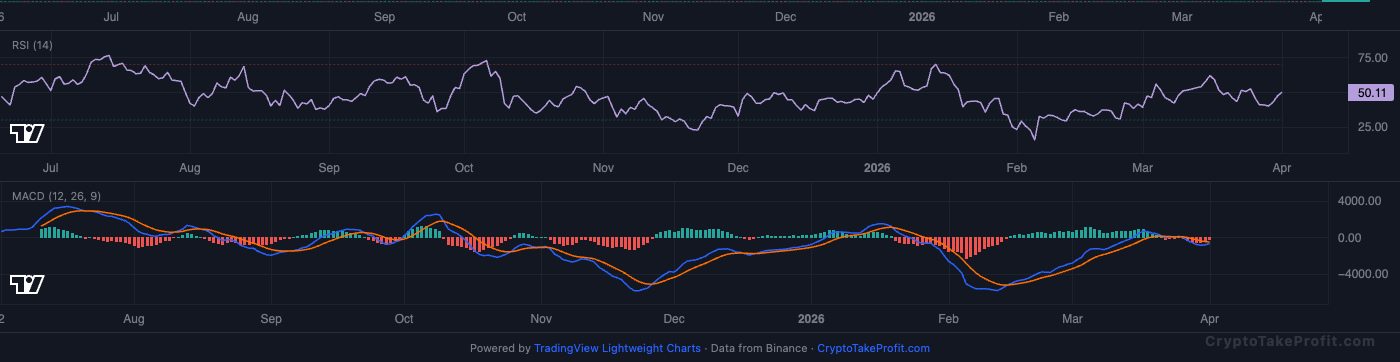
RSI reads 49.8, sitting in neutral range with no extreme readings. MACD has no active crossover, with negative histogram (-200.35) indicating downward pressure.
Market Structure
$69,164 sits just above EMA20 at $68,941, which signals short-term support holding while momentum remains weak. Indicator score at -5 and RSI at 49.8 suggest neutral-to-bearish conditions as of April 2026, while price remains below EMA50 at $71,073, showing broader trend pressure.
Volume Analysis
Volume at 0.68x average shows weak participation. Binance spot data indicates sub-1.0 volume ratio often precedes low-conviction moves, which aligns with the flat RSI and negative MACD histogram.
Key Levels
| Price | Type | Source | Significance | Distance |
|---|---|---|---|---|
| $74,886 | Resistance | Pivot R3 | Low | +8.3% |
| $73,941 | Resistance | BB Upper | Low | +6.9% |
| $72,065 | Resistance | Pivot R2 | Medium | +4.2% |
| $70,615 | Resistance | Pivot R1 | Medium | +2.1% |
| $69,164 | Current | — | — | — |
| $68,941 | Support | EMA20 | Low | -0.3% |
| $66,343 | Support | Pivot S1 | Medium | -4.1% |
| $65,500 | Support | BB Lower | Low | -5.3% |
| $63,522 | Support | Pivot S2 | Medium | -8.2% |
Moving Averages
| MA | Value | Position | Signal |
|---|---|---|---|
| EMA 20 | $68,941 | Above | Bullish |
| EMA 50 | $71,073 | Below | Bearish |
| EMA 200 | $87,195 | Below | Bearish |
| BB Middle (SMA 20) | $69,720 | Below | Bearish |
Trade Setup
BTC Scenario Analysis
Bullish Case
Trigger: N/A
Target: N/A
Invalidation: N/A
Base Case
Trigger: N/A
Target: N/A
Invalidation: N/A
Bearish Case
Trigger: N/A
Target: N/A
Invalidation: N/A
Bitcoin (BTC) Resources
Altcoin Overview
Among altcoins, AVAX leads with the strongest neutral signal (score: 0), while ADA shows the weakest setup (score: -45). Traders should focus on coins with clear directional signals and volume confirmation.
What to Watch
- BTC action around $69,164 for directional confirmation
- Fear & Greed at 8 for sentiment shift signals
- MACD crossover follow-through on top altcoins
- Volume confirmation on any support/resistance breaks
- BTC dominance at 56.3% for alt rotation signals