BTC Tests $66,685 Support Under Selling Pressure — Daily TA
Market Overview
The crypto market pulled back with total capitalization at $2.37T (-3.2%). BTC dominance sits at 56.1% while the Fear & Greed Index reads 12 (Extreme Fear), reflecting cautious sentiment.
Bitcoin (BTC) — $66,685
▼ WEAK BEARISH (Score: -30)
Price Action & Key Levels
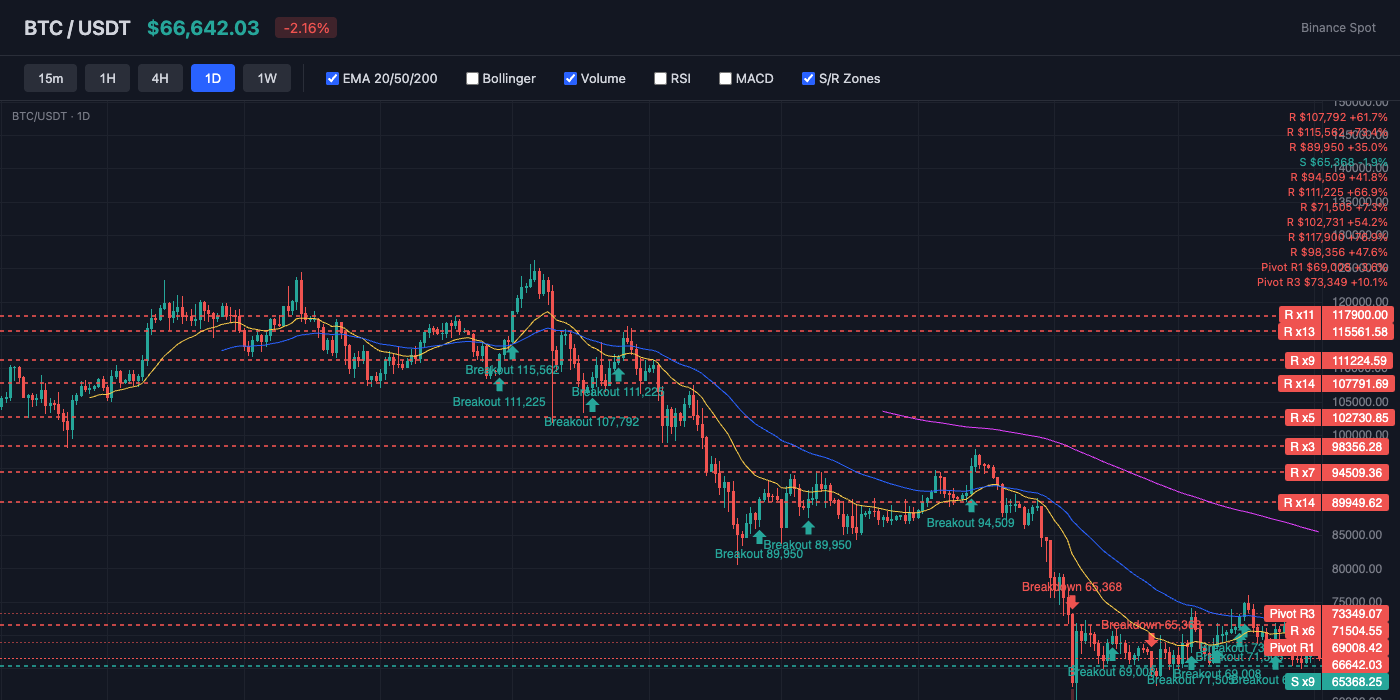
Bitcoin trades at $66,685, currently below the 20-day EMA ($68,758) and below the 50-day EMA ($70,891). The 200-day EMA at $87,031 serves as long-term resistance. Key resistance sits at $69,008 (Pivot R1), while support holds at $64,668 (Pivot S1). EMAs are stacked bearishly (20 < 50 < 200), indicating a sustained downtrend.
Bollinger Bands & Volatility
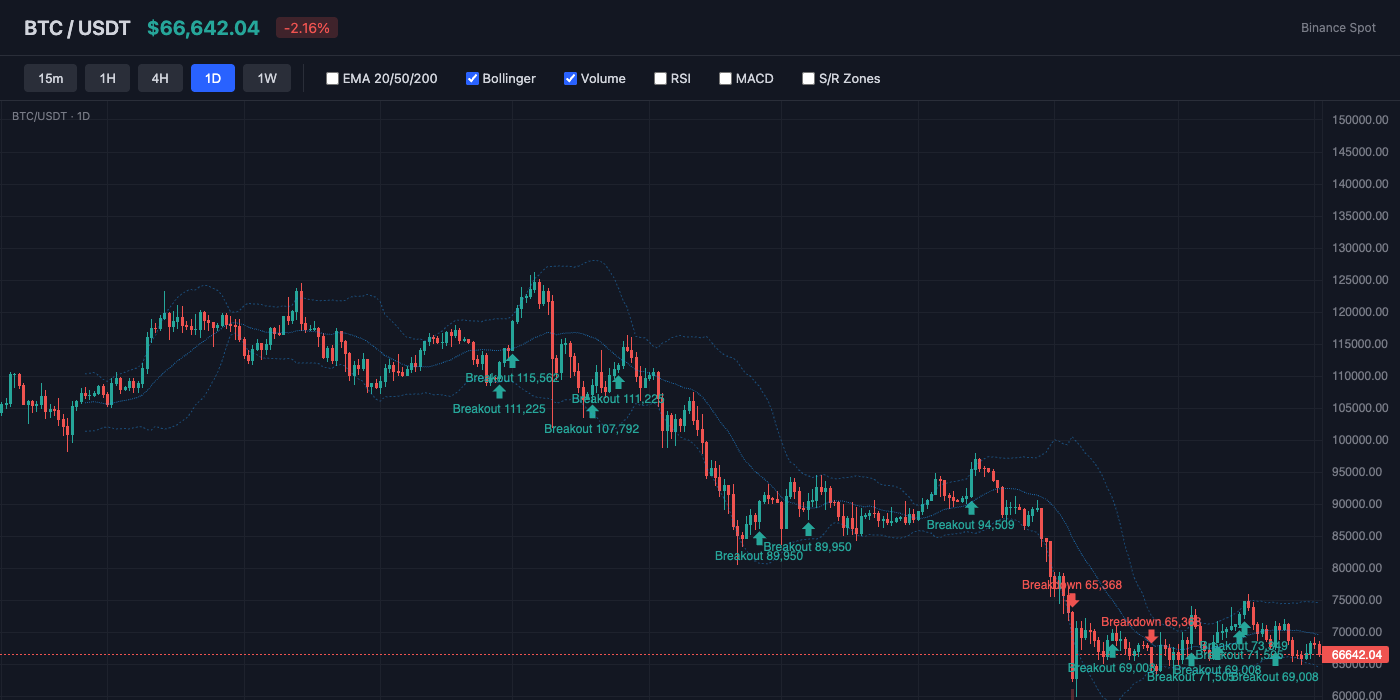
Bollinger Bands show a bandwidth of 12.4% (moderate volatility). Price hugs the lower band (%B: 18%), indicating oversold conditions or persistent selling. The middle band (SMA 20) at $69,451 acts as dynamic resistance.
Momentum Indicators
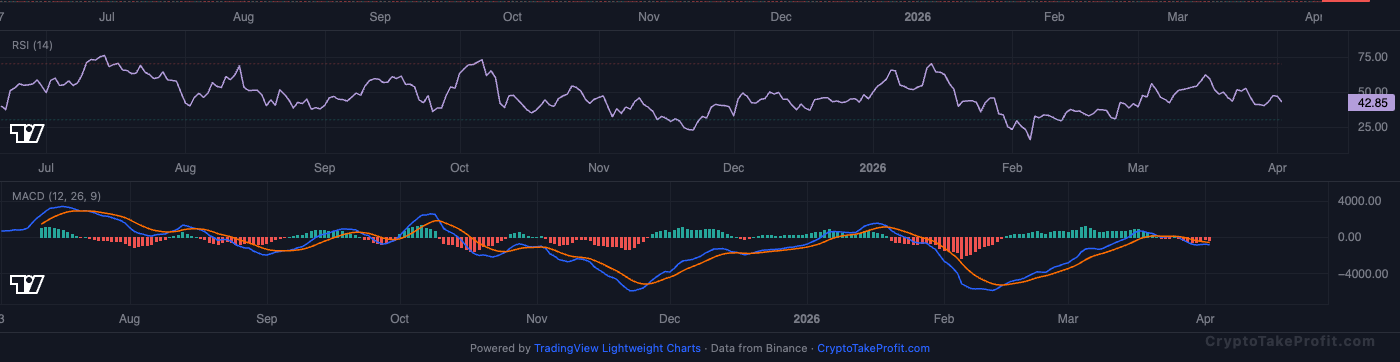
RSI reads 43.8, sitting in neutral range with no extreme readings. MACD has no active crossover, with negative histogram (-237.25) indicating downward pressure.
Market Structure
Price $66,685 sits below EMA20 at $68,758 and EMA50 at $70,891, confirming a short-term bearish structure as of the latest data. RSI at 43.8 and MACD histogram negative indicate weak momentum while Fear & Greed at 12 signals extreme fear, aligning with continued downside pressure unless a reclaim of $68,758 occurs.
Volume Analysis
Volume ratio at 0.42x average shows participation is low, while Open Interest at 88,037 contracts suggests leveraged positions remain active but not expanding aggressively. This imbalance indicates weak conviction on both sides, and price is more likely to drift or trend lower unless volume rises above the 1.0x average threshold with directional follow-through.
Key Levels
| Price | Type | Source | Significance | Distance |
|---|---|---|---|---|
| $76,012 | Resistance | Swing High | High | +14.0% |
| $73,349 | Resistance | Pivot R3 | Low | +10.0% |
| $71,331 | Resistance | Pivot R2 | Medium | +7.0% |
| $69,008 | Resistance | Pivot R1 | Medium | +3.5% |
| $66,685 | Current | — | — | — |
| $64,668 | Support | Pivot S1 | Medium | -3.0% |
| $62,650 | Support | Pivot S2 | Medium | -6.1% |
| $60,327 | Support | Pivot S3 | Low | -9.5% |
Moving Averages
| MA | Value | Position | Signal |
|---|---|---|---|
| EMA 20 | $68,758 | Below | Bearish |
| EMA 50 | $70,891 | Below | Bearish |
| EMA 200 | $87,031 | Below | Bearish |
| BB Middle (SMA 20) | $69,451 | Below | Bearish |
Trade Setup
BTC Scenario Analysis
Bullish Case
Trigger: Daily close above $69,008 with volume ≥1.0x average and RSI rising above 50
Target: $72,000
Invalidation: Daily close below $64,668
A breakout above resistance with expanding volume would shift momentum above EMA50 at $70,891, confirming trend reversal. This scenario requires both price acceptance above $69,008 and improving momentum to sustain continuation.
Base Case
Trigger: Price remains between $64,668 and $69,008 with volume below 1.0x average
Target: N/A
Invalidation: N/A
Consolidation persists while indicators remain weak, with EMA20 at $68,758 acting as dynamic resistance. Price oscillation within this range reflects indecision and low conviction until a breakout or breakdown occurs.
Bearish Case
Trigger: Breakdown below $64,668 with volume ≥1.2x average and RSI falling below 40
Target: $61,000
Invalidation: Daily close above $69,008
A break below pivot support with rising volume would confirm continuation of the bearish trend. This aligns with price trading below both EMA20 and EMA50, reinforcing downside momentum toward lower liquidity zones.
Bitcoin (BTC) Resources
Altcoin Overview
Among altcoins, SOL leads with the strongest neutral signal (score: -18), while ETH shows the weakest setup (score: -45). Traders should focus on coins with clear directional signals and volume confirmation.
What to Watch
- BTC action around $66,685 for directional confirmation
- Fear & Greed at 12 for sentiment shift signals
- MACD crossover follow-through on top altcoins
- Volume confirmation on any support/resistance breaks
- BTC dominance at 56.1% for alt rotation signals