BTC at $67,124 Hits Oversold Territory (RSI 25) — TA Report
Market Overview
The crypto market pulled back with total capitalization at $2.40T (-3.7%). BTC dominance sits at 55.9% while the Fear & Greed Index reads 11 (Extreme Fear), reflecting cautious sentiment.
Bitcoin (BTC) — $67,124
● CONFLICTED NEUTRAL (Score: -10)
Price Action & Key Levels
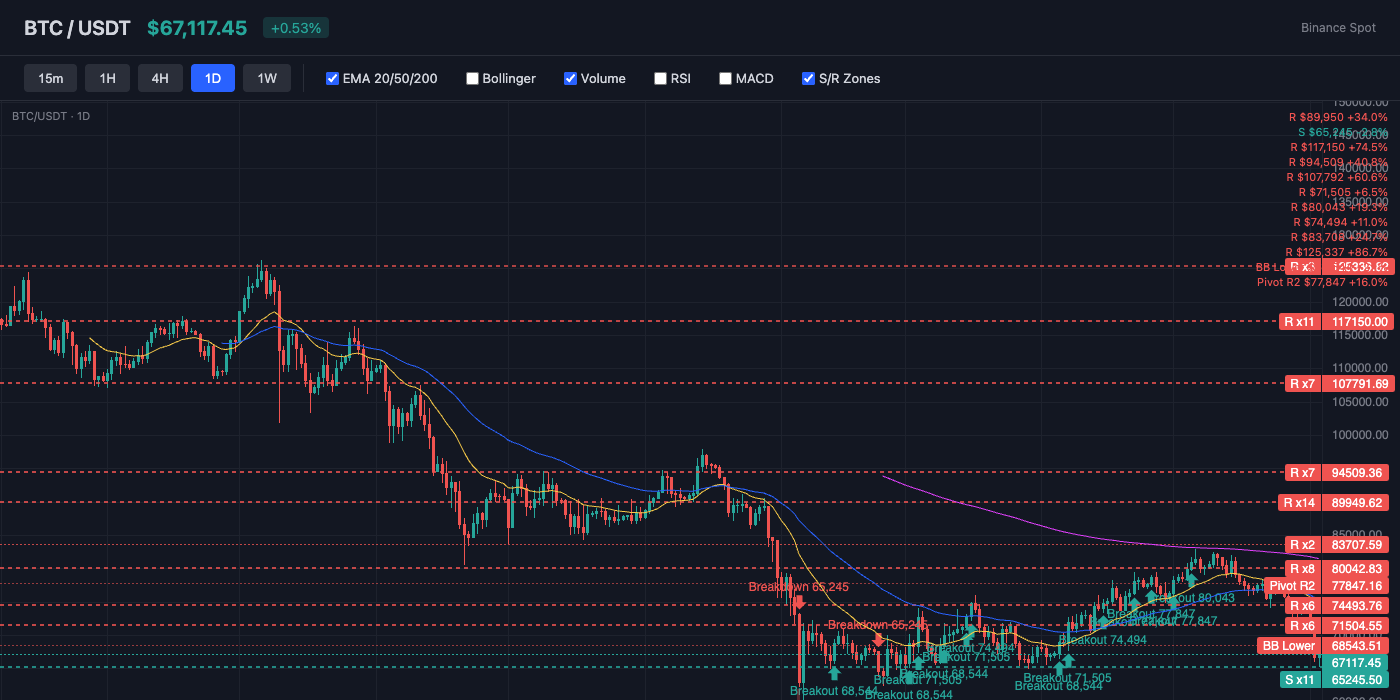
Bitcoin trades at $67,124, currently below the 20-day EMA ($74,577) and below the 50-day EMA ($75,329). The 200-day EMA at $83,148 serves as long-term resistance. Key resistance sits at $68,544 (BB Lower), while support holds at $63,602 (Pivot S1). EMAs are stacked bearishly (20 < 50 < 200), indicating a sustained downtrend.
Bollinger Bands & Volatility
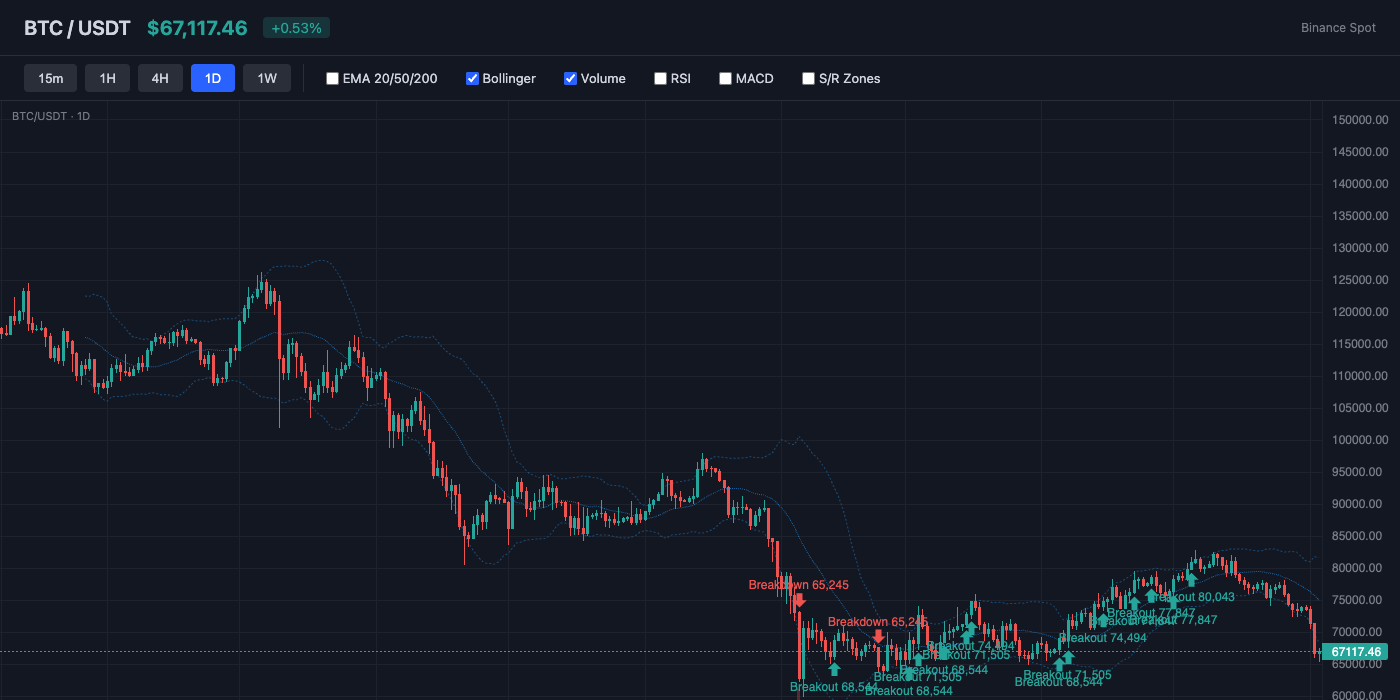
Bollinger Bands show a bandwidth of 17.4% (wide expansion — high volatility in play). Price hugs the lower band (%B: -11%), indicating oversold conditions or persistent selling. The middle band (SMA 20) at $75,057 acts as dynamic resistance.
Momentum Indicators
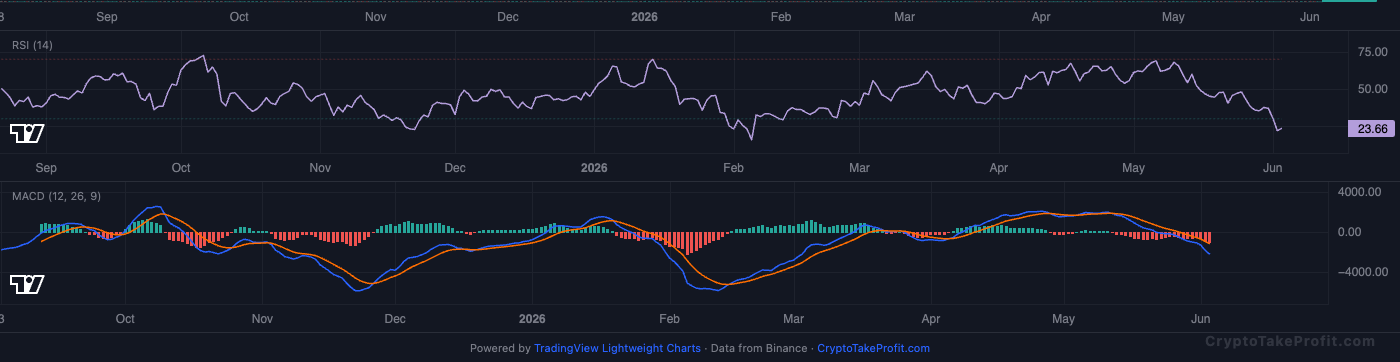
RSI reads 24.9, in oversold territory — a bounce attempt is likely. MACD has no active crossover, with negative histogram (-1013.87) indicating downward pressure.
Market Structure
BTC is trading at $67,124, well below the EMA20 at $74,577 and EMA50 at $75,329, keeping the broader trend bearish despite the conflicted -10 aggregate signal. RSI at 24.9 and BB %B at -10.9% show deeply oversold conditions, while Fear & Greed at 11 reflects capitulation-level sentiment.
Volume Analysis
Volume is running at 1.06x its average, which confirms active participation but not a decisive trend reversal. The modest volume expansion alongside a negative MACD histogram suggests sellers still have control, though the pace of selling may be slowing near support.
Key Levels
| Price | Type | Source | Significance | Distance |
|---|---|---|---|---|
| $77,847 | Resistance | Pivot R2 | Medium | +16.0% |
| $74,577 | Resistance | EMA20 | Low | +11.1% |
| $72,485 | Resistance | Pivot R1 | Medium | +8.0% |
| $68,544 | Resistance | BB Lower | Low | +2.1% |
| $67,124 | Current | — | — | — |
| $63,602 | Support | Pivot S1 | Medium | -5.2% |
| $60,081 | Support | Pivot S2 | Medium | -10.5% |
| $54,719 | Support | Pivot S3 | Low | -18.5% |
Moving Averages
| MA | Value | Position | Signal |
|---|---|---|---|
| EMA 20 | $74,577 | Below | Bearish |
| EMA 50 | $75,329 | Below | Bearish |
| EMA 200 | $83,148 | Below | Bearish |
| BB Middle (SMA 20) | $75,057 | Below | Bearish |
Trade Setup
BTC Scenario Analysis
Bullish Case
Trigger: Daily close above $68,544 resistance with sustained volume above current levels
Target: $74,577 (EMA20), then $75,329 (EMA50)
Invalidation: Daily close below $63,602 support
RSI at 24.9 and Extreme Fear at 11 create conditions for a relief rally if buyers reclaim $68,544. Positive funding at 0.0065% and a 1.61 long/short ratio indicate traders remain positioned for upside despite recent weakness.
Base Case
Trigger: Price remains between $63,602 and $68,544 over the next several sessions
Target: Range trade between $64,000 and $68,500
Invalidation: Break above $68,544 or below $63,602 with expanding volume
The conflicted -10 signal, average-like volume at 1.06x, and absence of major chart patterns point to consolidation. Traders may continue defending support while lacking sufficient momentum to challenge the EMA20 at $74,577.
Bearish Case
Trigger: Daily close below $63,602 support with rising volume
Target: $61,450 initially, then approximately $59,300 based on a one-ATR extension below support
Invalidation: Recovery above $68,544
Price remains significantly below both key EMAs, and the MACD histogram is still negative. If support fails, elevated open interest of 106,393 contracts could contribute to long liquidation pressure and accelerate downside movement.
Bitcoin (BTC) Resources
Altcoin Overview
Among altcoins, ETH leads with the strongest neutral signal (score: -10), while BNB shows the weakest setup (score: -35). Traders should focus on coins with clear directional signals and volume confirmation.
What to Watch
- BTC action around $67,124 for directional confirmation
- Fear & Greed at 11 for sentiment shift signals
- MACD crossover follow-through on top altcoins
- Volume confirmation on any support/resistance breaks
- BTC dominance at 55.9% for alt rotation signals