BTC at $61,476 Hits Oversold Territory (RSI 18) — TA Report
Market Overview
The crypto market pulled back with total capitalization at $2.20T (-4.0%). BTC dominance sits at 56.0% while the Fear & Greed Index reads 12 (Extreme Fear), reflecting cautious sentiment.
Bitcoin (BTC) — $61,476
● CONFLICTED NEUTRAL (Score: -10)
Price Action & Key Levels
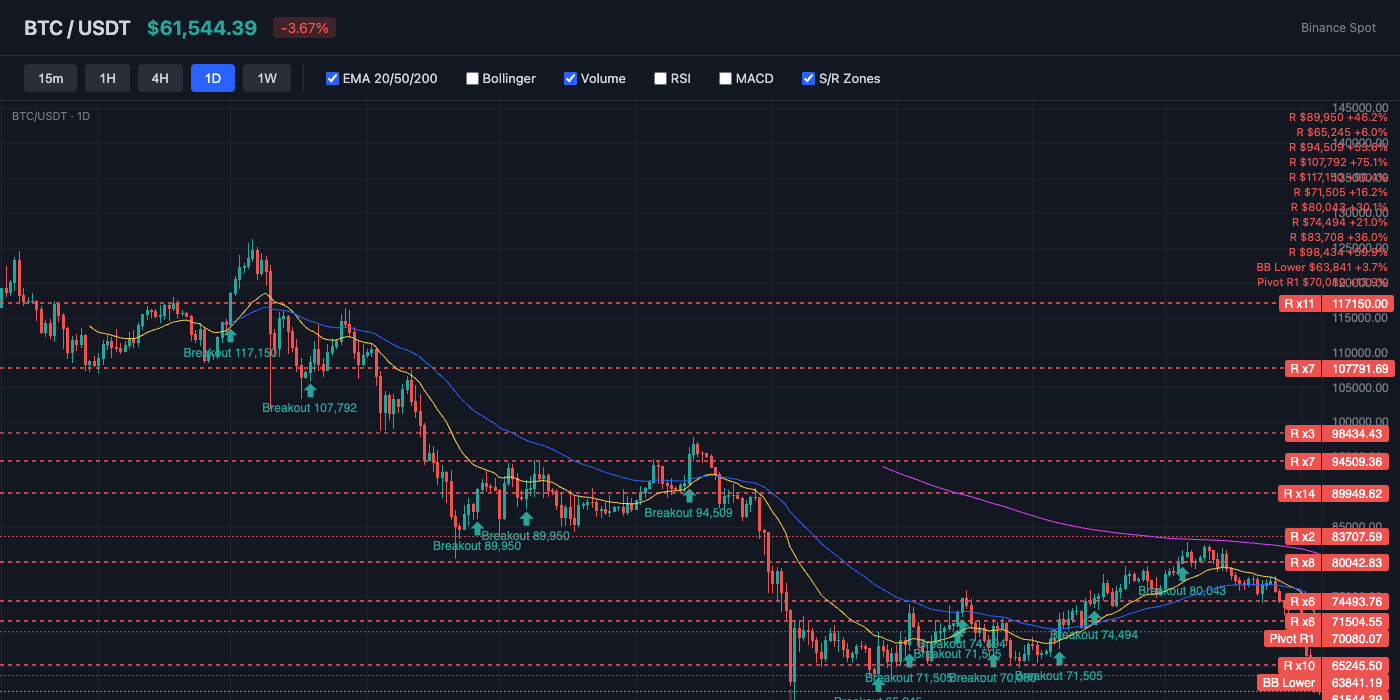
Bitcoin trades at $61,476, currently below the 20-day EMA ($72,287) and below the 50-day EMA ($74,317). The 200-day EMA at $82,786 serves as long-term resistance. Key resistance sits at $63,841 (BB Lower), while support holds at $56,998 (Pivot S1). EMAs are stacked bearishly (20 < 50 < 200), indicating a sustained downtrend.
Bollinger Bands & Volatility
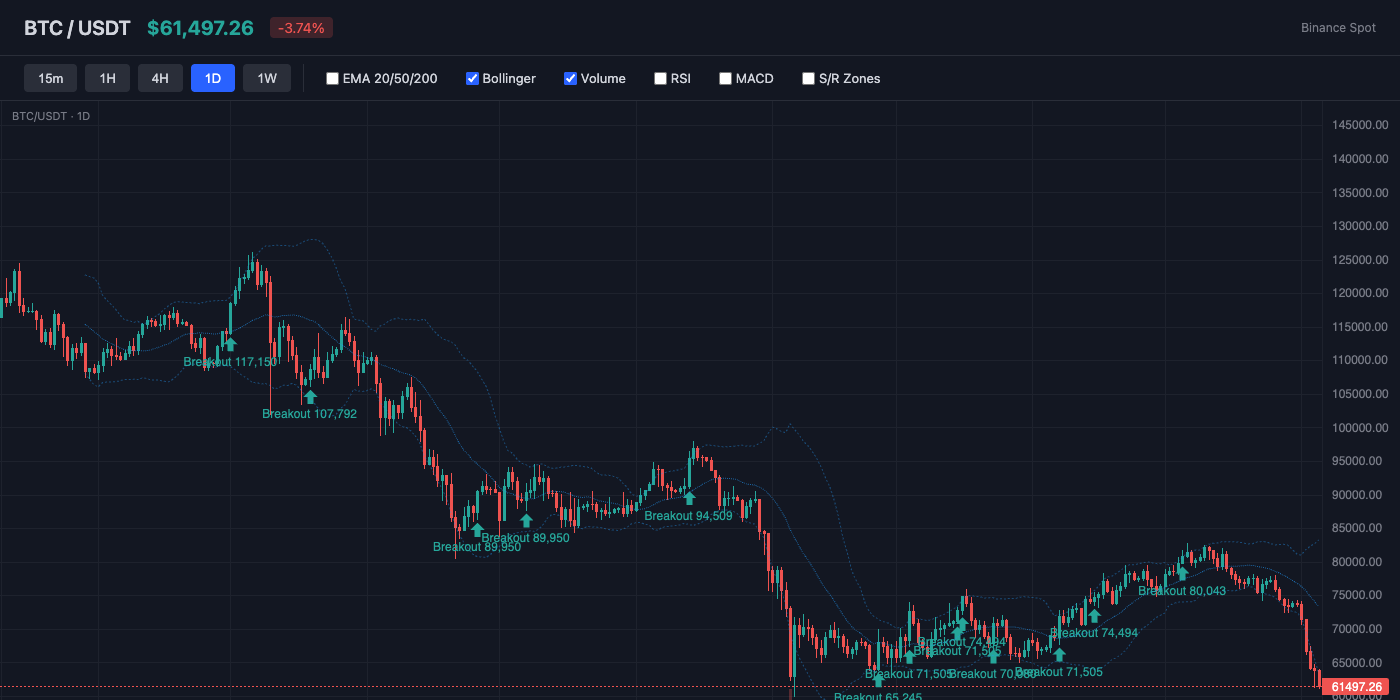
Bollinger Bands show a bandwidth of 26.1% (wide expansion — high volatility in play). Price hugs the lower band (%B: -12%), indicating oversold conditions or persistent selling. The middle band (SMA 20) at $73,403 acts as dynamic resistance.
Momentum Indicators
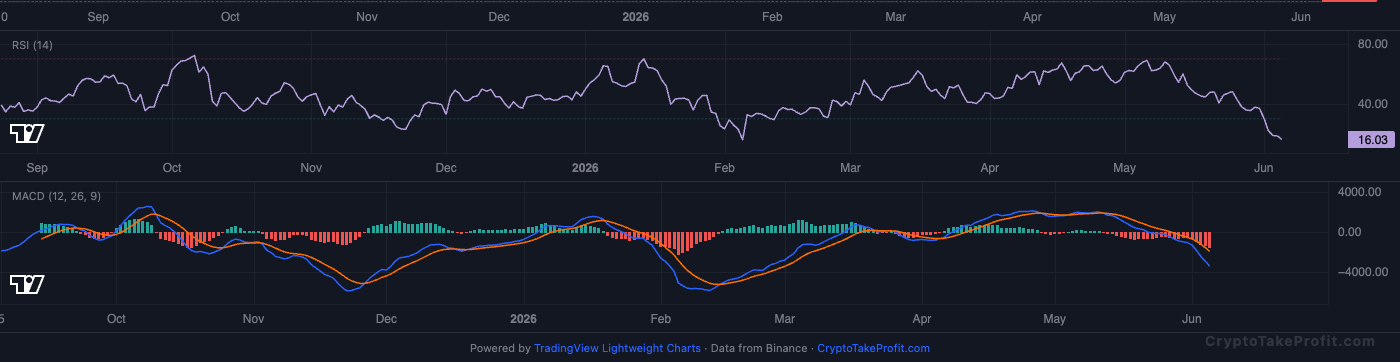
RSI reads 18.1, in oversold territory — a bounce attempt is likely. MACD has no active crossover, with negative histogram (-1468.59) indicating downward pressure.
Market Structure
Price sits 15% below EMA20 ($72,287) and 17% below EMA50 ($74,317). BB %B at -12.4% means price trades well below the lower band. ATR of $2,392 indicates daily swings of roughly 3.9% in either direction.
Volume Analysis
Volume ratio at 1.01x average shows no panic selling. Funding rate at -0.0018% reflects mild bearish bias. Open interest holds at 100,085 contracts despite the drop, per CoinGlass data as of 6:30 PM ET.
Key Levels
| Price | Type | Source | Significance | Distance |
|---|---|---|---|---|
| $74,317 | Resistance | EMA50 | Medium | +20.9% |
| $72,287 | Resistance | EMA20 | Low | +17.6% |
| $70,080 | Resistance | Pivot R1 | Medium | +14.0% |
| $63,841 | Resistance | BB Lower | Low | +3.8% |
| $61,476 | Current | — | — | — |
| $56,998 | Support | Pivot S1 | Medium | -7.3% |
| $52,521 | Support | Pivot S2 | Medium | -14.6% |
| $43,917 | Support | Pivot S3 | Low | -28.6% |
Moving Averages
| MA | Value | Position | Signal |
|---|---|---|---|
| EMA 20 | $72,287 | Below | Bearish |
| EMA 50 | $74,317 | Below | Bearish |
| EMA 200 | $82,786 | Below | Bearish |
| BB Middle (SMA 20) | $73,403 | Below | Bearish |
Trade Setup
BTC Scenario Analysis
Bullish Case
Trigger: Price reclaims $63,841 (BB lower band) on 1.5x average volume
Target: $72,287 (EMA20)
Invalidation: Price breaks $56,998 on rising volume
Extreme Fear at 12 often precedes reversals. RSI at 18.1 supports a snapback trade if buyers defend $56,998.
Base Case
Trigger: Price holds between $56,998 and $60,000 for 24 hours
Target: $60,000 to $63,841
Invalidation: N/A
Negative MACD and conflicting signal (-10) favor sideways chop. Long/Short ratio at 1.20 shows mild long bias, which caps upside without a leverage flush.
Bearish Case
Trigger: Daily close below $56,998 (Pivot S1)
Target: $52,400 (next support per order book data)
Invalidation: N/A
BB %B at -12.4% can stretch to -20% in capitulations. Funding at -0.0018% offers no crowded short squeeze fuel.
Bitcoin (BTC) Resources
Altcoin Overview
Among altcoins, BNB leads with the strongest neutral signal (score: 2), while AVAX shows the weakest setup (score: -10). Traders should focus on coins with clear directional signals and volume confirmation.
What to Watch
- BTC action around $61,476 for directional confirmation
- Fear & Greed at 12 for sentiment shift signals
- MACD crossover follow-through on top altcoins
- Volume confirmation on any support/resistance breaks
- BTC dominance at 56.0% for alt rotation signals