BTC at $61,048 Hits Oversold Territory (RSI 20) — TA Report
Market Overview
The crypto market pulled back with total capitalization at $2.17T (-3.4%). BTC dominance sits at 56.2% while the Fear & Greed Index reads 12 (Extreme Fear), reflecting cautious sentiment.
Bitcoin (BTC) — $61,048
● CONFLICTED NEUTRAL (Score: -10)
Price Action & Key Levels
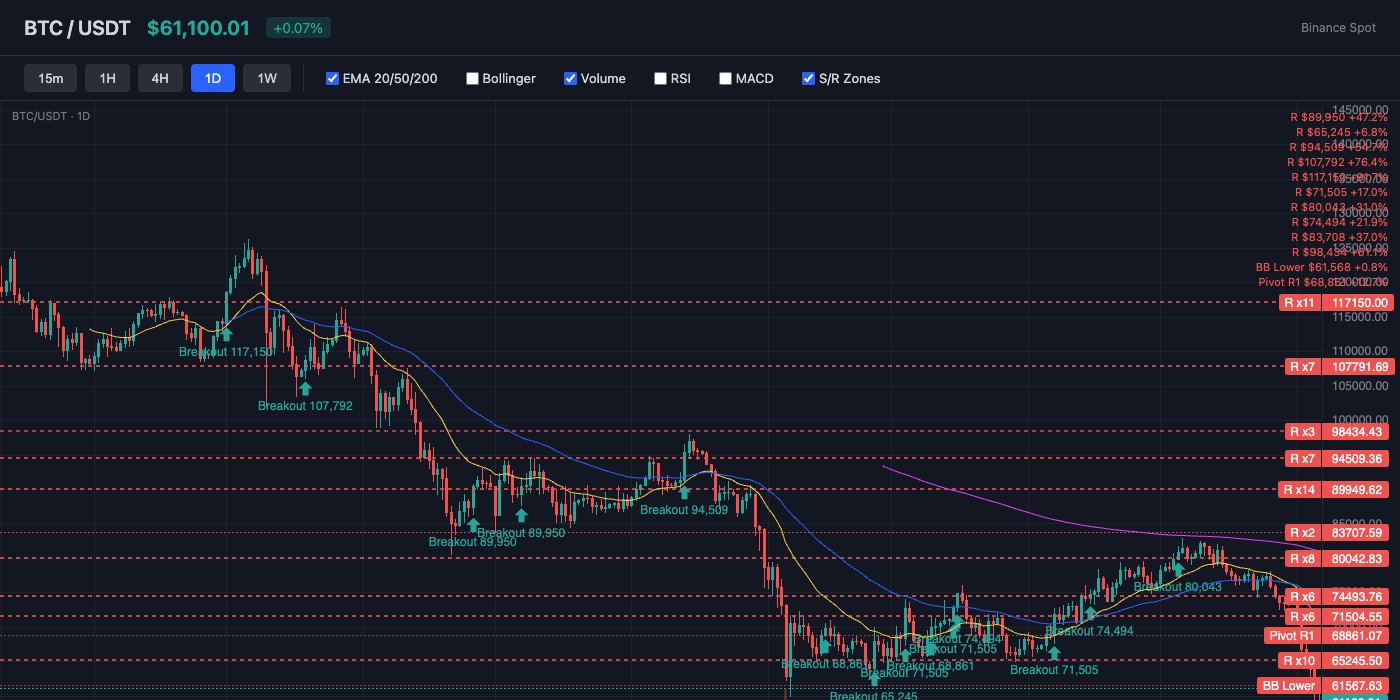
Bitcoin trades at $61,048, currently below the 20-day EMA ($71,154) and below the 50-day EMA ($73,758). The 200-day EMA at $82,578 serves as long-term resistance. Key resistance sits at $61,568 (BB Lower), while support holds at $56,181 (Pivot S1). EMAs are stacked bearishly (20 < 50 < 200), indicating a sustained downtrend.
Bollinger Bands & Volatility
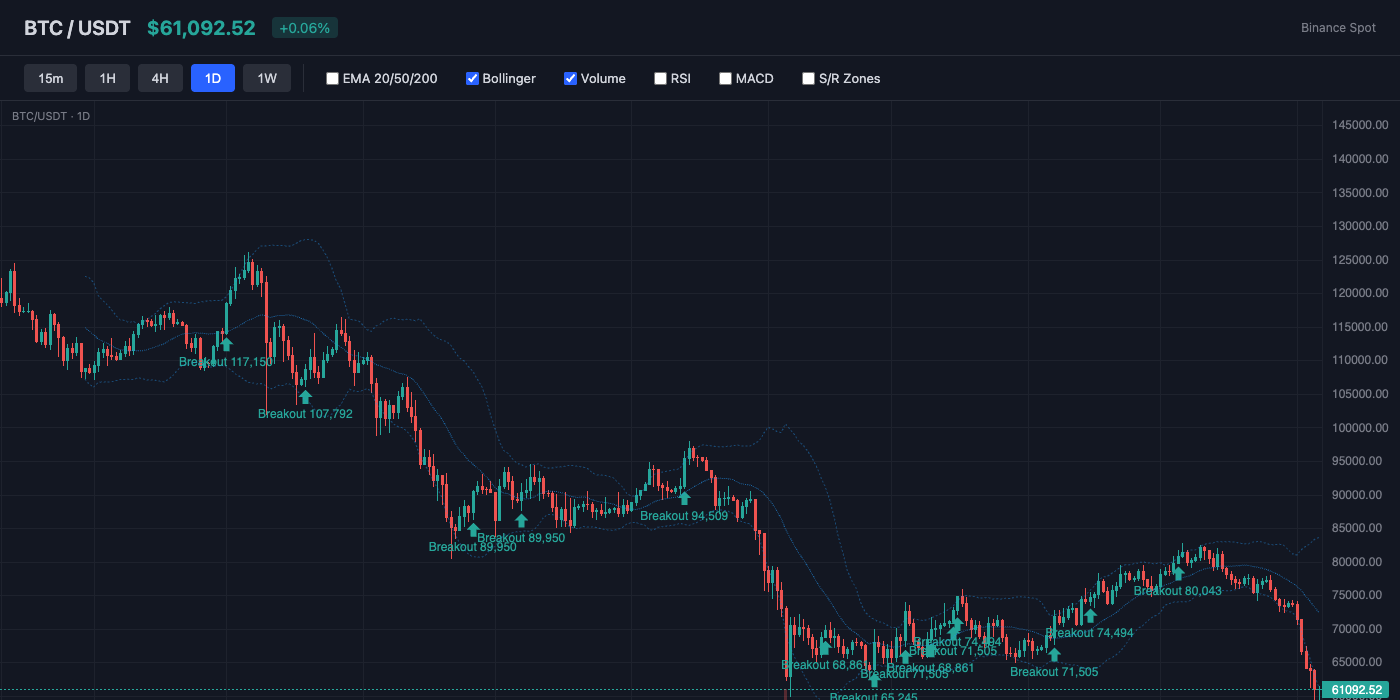
Bollinger Bands show a bandwidth of 30.2% (wide expansion — high volatility in play). Price hugs the lower band (%B: -2%), indicating oversold conditions or persistent selling. The middle band (SMA 20) at $72,501 acts as dynamic resistance.
Momentum Indicators
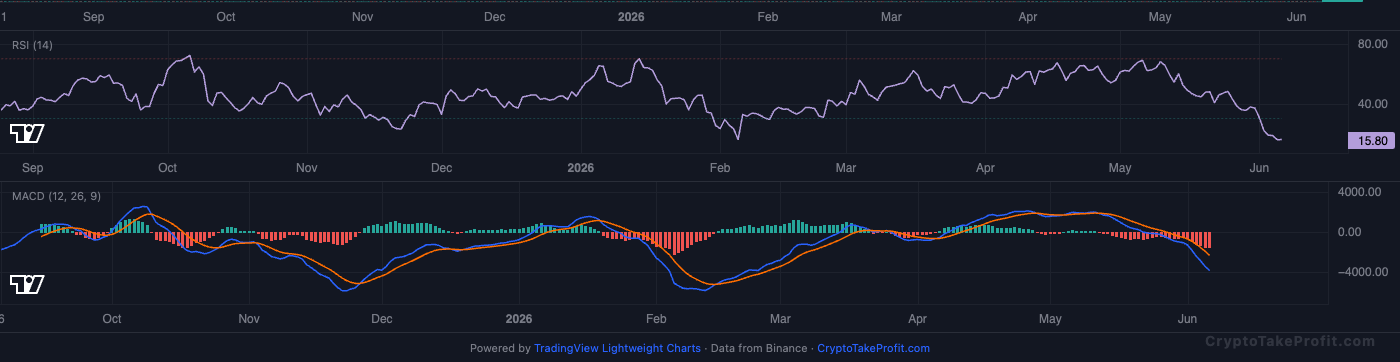
RSI reads 19.8, in oversold territory — a bounce attempt is likely. MACD has no active crossover, with negative histogram (-1561.82) indicating downward pressure.
Market Structure
BTC trades at $61,048 while sitting 14.2% below the EMA20 at $71,154 and 17.2% below the EMA50 at $73,758. RSI at 19.8 signals deeply oversold conditions, but the negative MACD histogram and Signal score of -10 show momentum remains bearish despite the stretched downside. Fear & Greed stands at 12, an Extreme Fear reading, while total crypto market capitalization has fallen to $2.17T, down 3.4%. Price is holding above Pivot S1 support at $56,181 but remains below resistance at $61,568.
Volume Analysis
Volume is running at 0.91x average, indicating the selloff lacks strong participation from new sellers. Open Interest remains elevated at 101,945 contracts and the Long/Short Ratio is 1.14, showing traders are still slightly positioned for upside despite recent weakness. The combination of low volume, positive funding of 0.0018%, and elevated open interest suggests positioning has not fully reset. This raises the risk of another volatility event if support fails.
Key Levels
| Price | Type | Source | Significance | Distance |
|---|---|---|---|---|
| $73,758 | Resistance | EMA50 | Medium | +20.8% |
| $71,154 | Resistance | EMA20 | Low | +16.6% |
| $68,861 | Resistance | Pivot R1 | Medium | +12.8% |
| $61,568 | Resistance | BB Lower | Low | +0.9% |
| $61,048 | Current | — | — | — |
| $56,181 | Support | Pivot S1 | Medium | -8.0% |
| $51,315 | Support | Pivot S2 | Medium | -15.9% |
| $43,501 | Support | Pivot S3 | Low | -28.7% |
Moving Averages
| MA | Value | Position | Signal |
|---|---|---|---|
| EMA 20 | $71,154 | Below | Bearish |
| EMA 50 | $73,758 | Below | Bearish |
| EMA 200 | $82,578 | Below | Bearish |
| BB Middle (SMA 20) | $72,501 | Below | Bearish |
Trade Setup
BTC Scenario Analysis
Bullish Case
Trigger: Daily close above $61,568 resistance with volume rising above 1.0x average
Target: $66,000
Invalidation: N/A
Base Case
Trigger: BTC remains between $56,181 support and $61,568 resistance
Target: $58,000-$61,500 range
Invalidation: N/A
Bearish Case
Trigger: Daily close below $56,181 support
Target: $53,500
Invalidation: N/A
Bitcoin (BTC) Resources
Altcoin Overview
Among altcoins, ETH leads with the strongest neutral signal (score: -10), while BNB shows the weakest setup (score: -18). Traders should focus on coins with clear directional signals and volume confirmation.
What to Watch
- BTC action around $61,048 for directional confirmation
- Fear & Greed at 12 for sentiment shift signals
- MACD crossover follow-through on top altcoins
- Volume confirmation on any support/resistance breaks
- BTC dominance at 56.2% for alt rotation signals