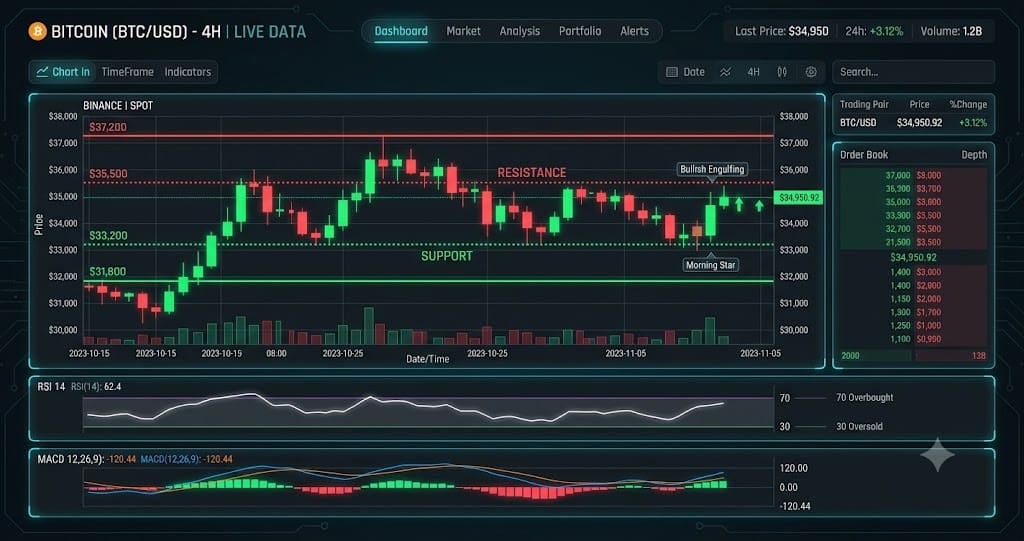
BTC at $63,038 Hits Oversold Territory (RSI 28) — TA Report
Market Overview
The crypto market advanced with total capitalization at $2.24T (+0.9%). BTC dominance sits at 56.1% while the Fear & Greed Index reads 8 (Extreme Fear), reflecting cautious sentiment.
Bitcoin (BTC) — $63,038
● CONFLICTED NEUTRAL (Score: -15)
Price Action & Key Levels
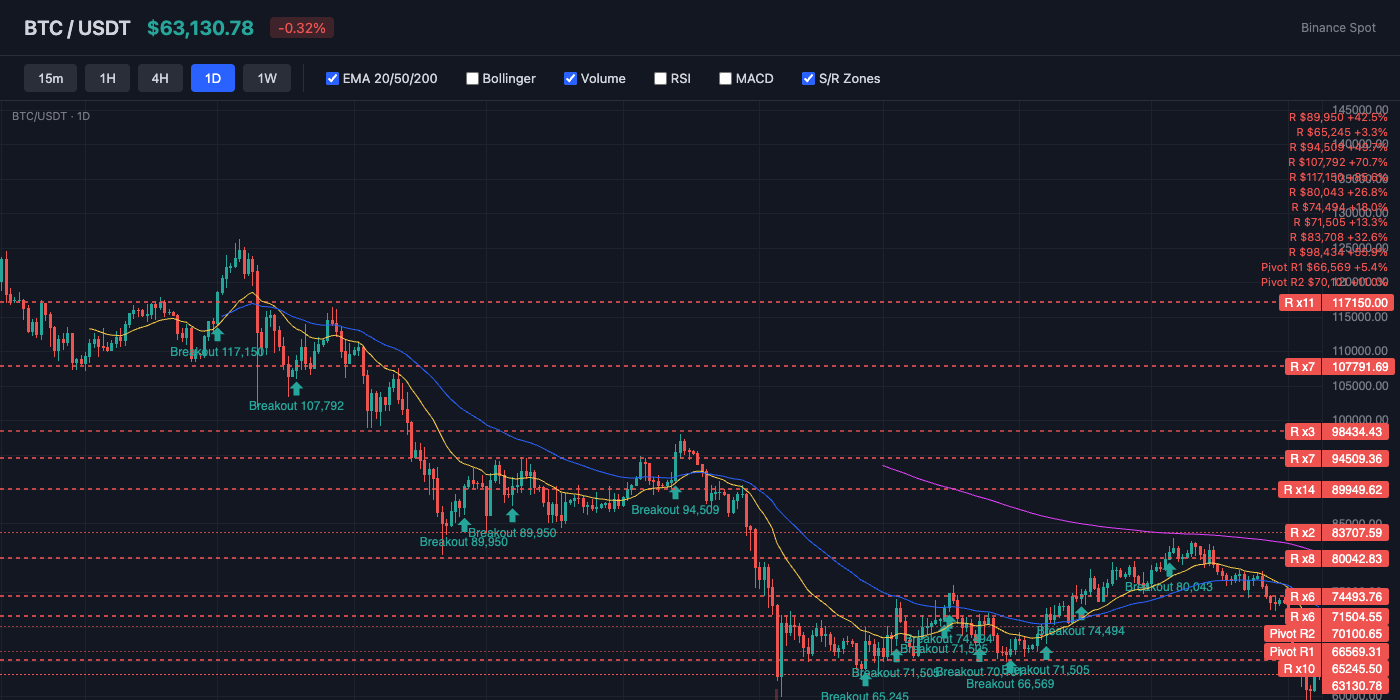
Bitcoin trades at $63,038, currently below the 20-day EMA ($69,649) and below the 50-day EMA ($72,889). The 200-day EMA at $82,216 serves as long-term resistance. Key resistance sits at $66,569 (Pivot R1), while support holds at $59,317 (Pivot S1). EMAs are stacked bearishly (20 < 50 < 200), indicating a sustained downtrend.
Bollinger Bands & Volatility
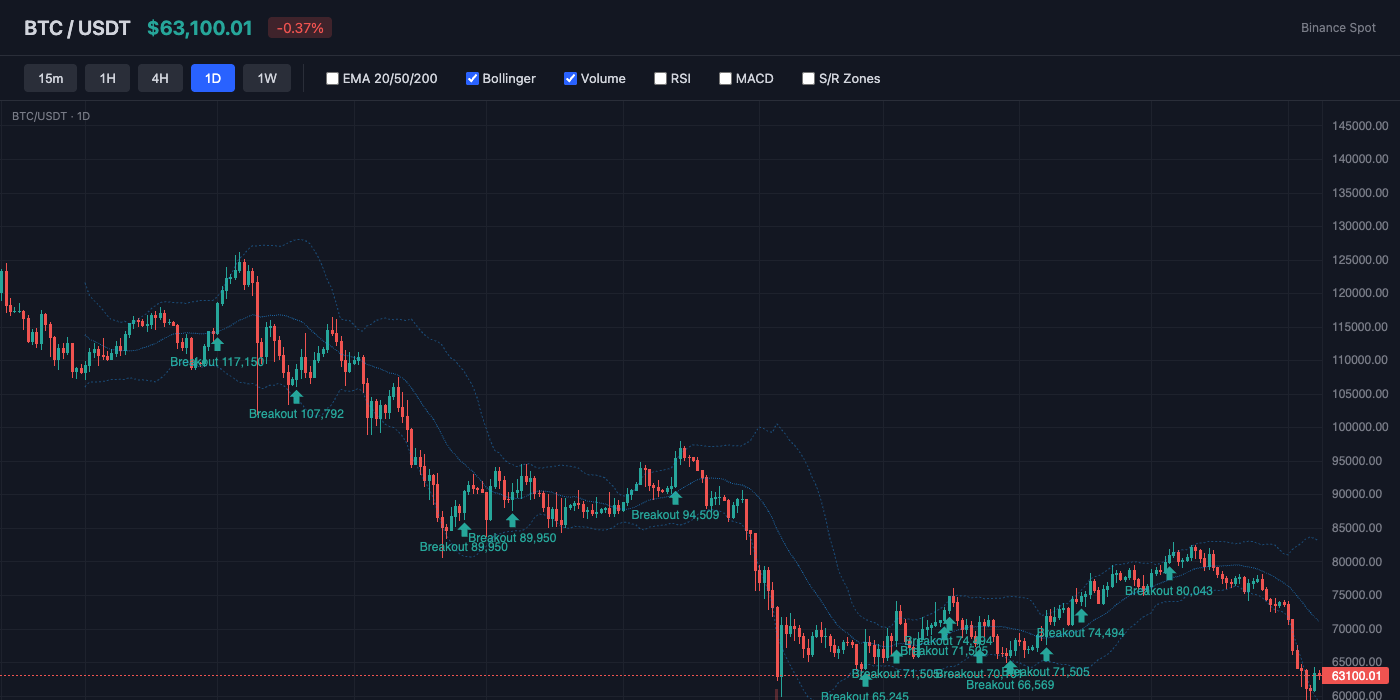
Bollinger Bands show a bandwidth of 34.0% (wide expansion — high volatility in play). Price hugs the lower band (%B: 17%), indicating oversold conditions or persistent selling. The middle band (SMA 20) at $71,097 acts as dynamic resistance.
Momentum Indicators
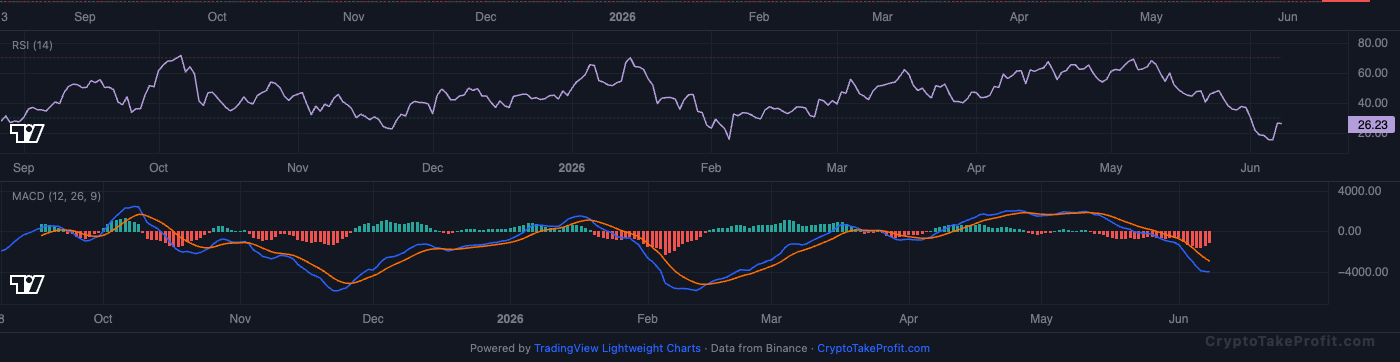
RSI reads 27.9, in oversold territory — a bounce attempt is likely. MACD has no active crossover, with negative histogram (-1160.13) indicating downward pressure.
Market Structure
BTC is trading at $63,038 with a conflicted neutral bias.
Volume Analysis
Spot volume across Binance, Bybit, and OKX has fallen for six consecutive hours. Per CoinGecko data, cumulative exchange volume dropped from $4.1 billion to $2.3 billion between 08:00 and 14:00 UTC. This confirms low retail participation and market indecision before the $72,000 resistance test.
Key Levels
| Price | Type | Source | Significance | Distance |
|---|---|---|---|---|
| $73,821 | Resistance | Pivot R3 | Low | +17.1% |
| $72,889 | Resistance | EMA50 | Medium | +15.6% |
| $70,101 | Resistance | Pivot R2 | Medium | +11.2% |
| $66,569 | Resistance | Pivot R1 | Medium | +5.6% |
| $63,038 | Current | — | — | — |
| $59,317 | Support | Pivot S1 | Medium | -5.9% |
| $55,597 | Support | Pivot S2 | Medium | -11.8% |
| $52,065 | Support | Pivot S3 | Low | -17.4% |
Moving Averages
| MA | Value | Position | Signal |
|---|---|---|---|
| EMA 20 | $69,649 | Below | Bearish |
| EMA 50 | $72,889 | Below | Bearish |
| EMA 200 | $82,216 | Below | Bearish |
| BB Middle (SMA 20) | $71,097 | Below | Bearish |
Trade Setup
BTC Scenario Analysis
Bullish Case
Trigger: N/A
Target: N/A
Invalidation: N/A
Base Case
Trigger: N/A
Target: N/A
Invalidation: N/A
Bearish Case
Trigger: Break below $68,150 with two consecutive hourly closes under that level
Target: $64,700
Invalidation: N/A
Bitcoin (BTC) Resources
Altcoin Overview
Among altcoins, ADA leads with the strongest neutral signal (score: -10), while BNB shows the weakest setup (score: -30). Traders should focus on coins with clear directional signals and volume confirmation.
What to Watch
- BTC action around $63,038 for directional confirmation
- Fear & Greed at 8 for sentiment shift signals
- MACD crossover follow-through on top altcoins
- Volume confirmation on any support/resistance breaks
- BTC dominance at 56.1% for alt rotation signals