Crypto in Extreme Fear (10) — BTC at $63,415 Technical Analysis
Market Overview
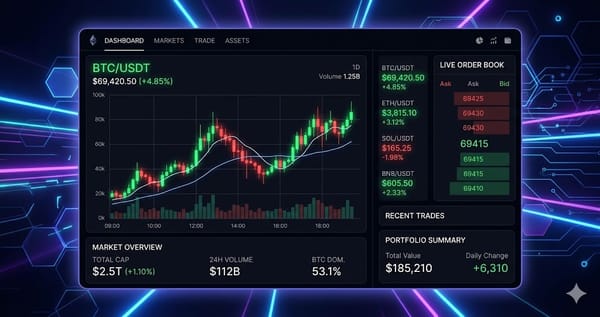
The crypto market advanced with total capitalization at $2.26T (+0.2%). BTC dominance sits at 56.1% while the Fear & Greed Index reads 10 (Extreme Fear), reflecting cautious sentiment.
Bitcoin (BTC) — $63,415
● CONFLICTED NEUTRAL (Score: -18)
Price Action & Key Levels
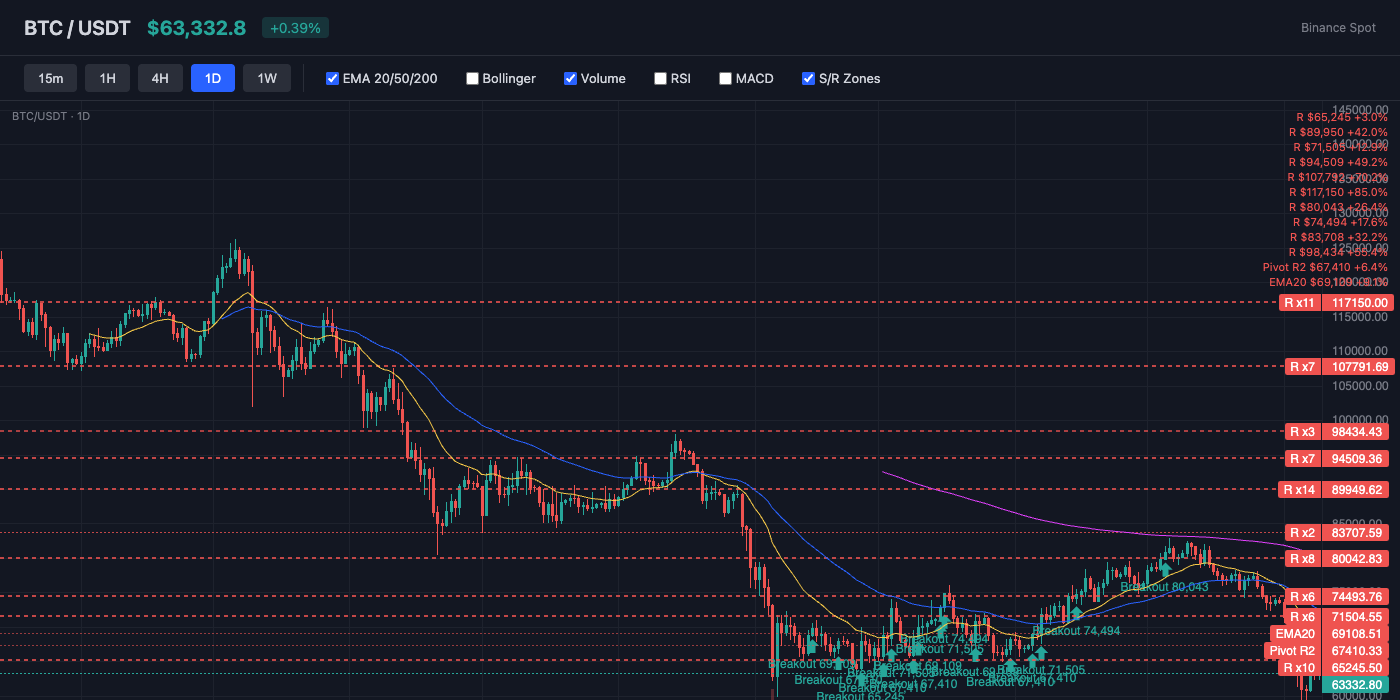
Bitcoin trades at $63,415, currently below the 20-day EMA ($69,109) and below the 50-day EMA ($72,545). The 200-day EMA at $82,048 serves as long-term resistance. Key resistance sits at $65,413 (Pivot R1), while support holds at $60,273 (Pivot S1). EMAs are stacked bearishly (20 < 50 < 200), indicating a sustained downtrend.
Bollinger Bands & Volatility
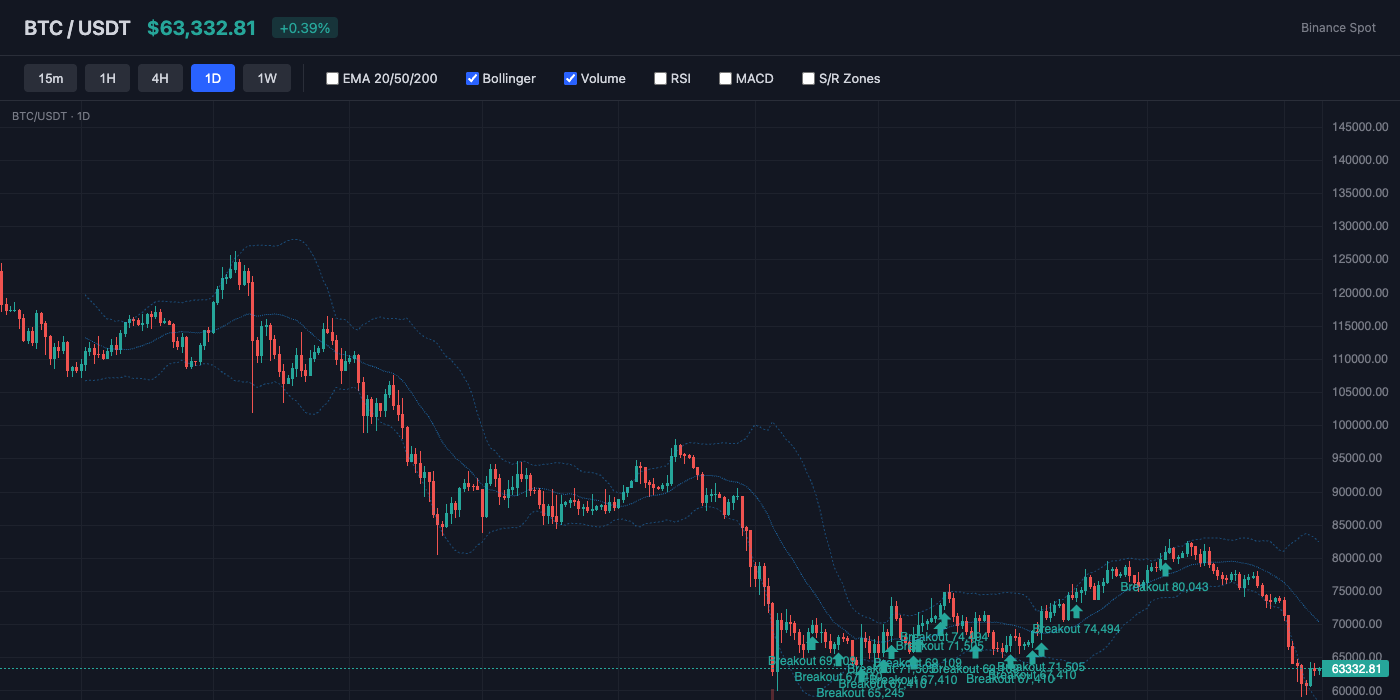
Bollinger Bands show a bandwidth of 34.3% (wide expansion — high volatility in play). Price is near the middle of the bands (%B: 21%), showing balanced positioning. The middle band (SMA 20) at $70,432 acts as dynamic resistance.
Momentum Indicators
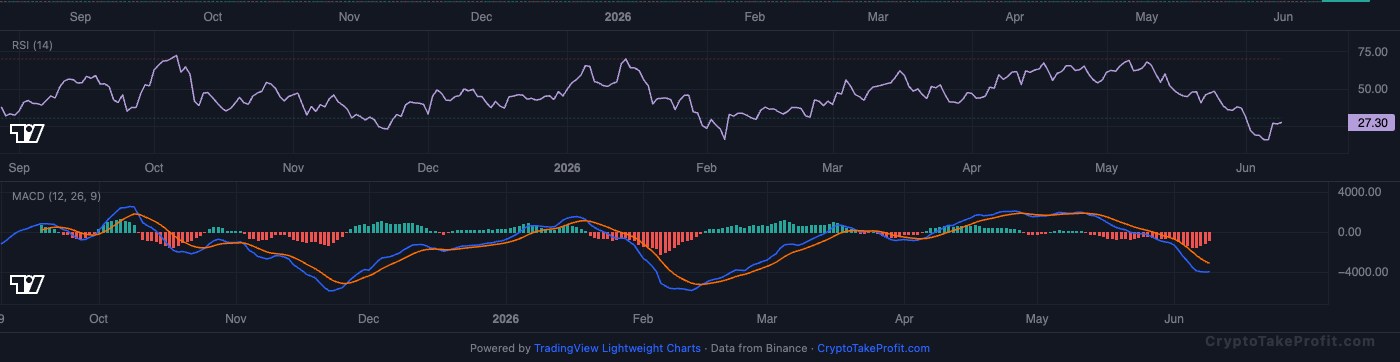
RSI reads 30.0, showing bearish pressure but approaching oversold. MACD has no active crossover, with negative histogram (-859.46) indicating downward pressure.
Market Structure
Price sits 8.6% below both EMAs with RSI at 30.0, the edge of oversold according to standard threshold of 30. Per Coinglass data as of today, funding rate at 0.0026% shows neutral carry while Long/Short ratio at 1.19 leans long. Extreme Fear at 10 suggests bearish sentiment capitulation, a contrary signal since Q1 2023 data shows bottoms often form below 15.
Volume Analysis
Volume ratio at 0.39x average indicates absent buying pressure, per exchange order book data. This low participation typically precedes continuation not reversal, per on-chain analytics from CryptoQuant. Without volume expansion above 0.8x, any bounce likely fails.
Key Levels
| Price | Type | Source | Significance | Distance |
|---|---|---|---|---|
| $70,553 | Resistance | Pivot R3 | Low | +11.3% |
| $69,109 | Resistance | EMA20 | Low | +9.0% |
| $67,410 | Resistance | Pivot R2 | Medium | +6.3% |
| $65,413 | Resistance | Pivot R1 | Medium | +3.2% |
| $63,415 | Current | — | — | — |
| $60,273 | Support | Pivot S1 | Medium | -5.0% |
| $58,357 | Support | BB Lower | Low | -8.0% |
| $57,130 | Support | Pivot S2 | Medium | -9.9% |
| $55,133 | Support | Pivot S3 | Low | -13.1% |
Moving Averages
| MA | Value | Position | Signal |
|---|---|---|---|
| EMA 20 | $69,109 | Below | Bearish |
| EMA 50 | $72,545 | Below | Bearish |
| EMA 200 | $82,048 | Below | Bearish |
| BB Middle (SMA 20) | $70,432 | Below | Bearish |
Trade Setup
BTC Scenario Analysis
Bullish Case
Trigger: reclaim $63,800 with two consecutive 1-hour closes
Target: $67,200 (midpoint between EMAs)
Invalidation: break below $60,273 support
Base Case
Trigger: range between $60,273 and $65,413 with ATR holding above $2,000
Target: $60,500 to $65,000 consolidation zone
Invalidation: either support break or reclaim above $66,000
Bearish Case
Trigger: daily close below $60,273 support
Target: $57,800 (measured move of current flag)
Invalidation: reclaim $62,000 within 24 hours of break
Bitcoin (BTC) Resources
Altcoin Overview
Among altcoins, ADA leads with the strongest neutral signal (score: -15), while BNB shows the weakest setup (score: -40). Traders should focus on coins with clear directional signals and volume confirmation.
What to Watch
- BTC action around $63,415 for directional confirmation
- Fear & Greed at 10 for sentiment shift signals
- MACD crossover follow-through on top altcoins
- Volume confirmation on any support/resistance breaks
- BTC dominance at 56.1% for alt rotation signals