Crypto in Extreme Fear (18) — BTC at $64,250 Technical Analysis
Market Overview
The crypto market advanced with total capitalization at $2.28T (+1.0%). BTC dominance sits at 56.6% while the Fear & Greed Index reads 18 (Extreme Fear), reflecting cautious sentiment.
Bitcoin (BTC) — $64,250
▲ WEAK BULLISH (Score: 2)
Price Action & Key Levels
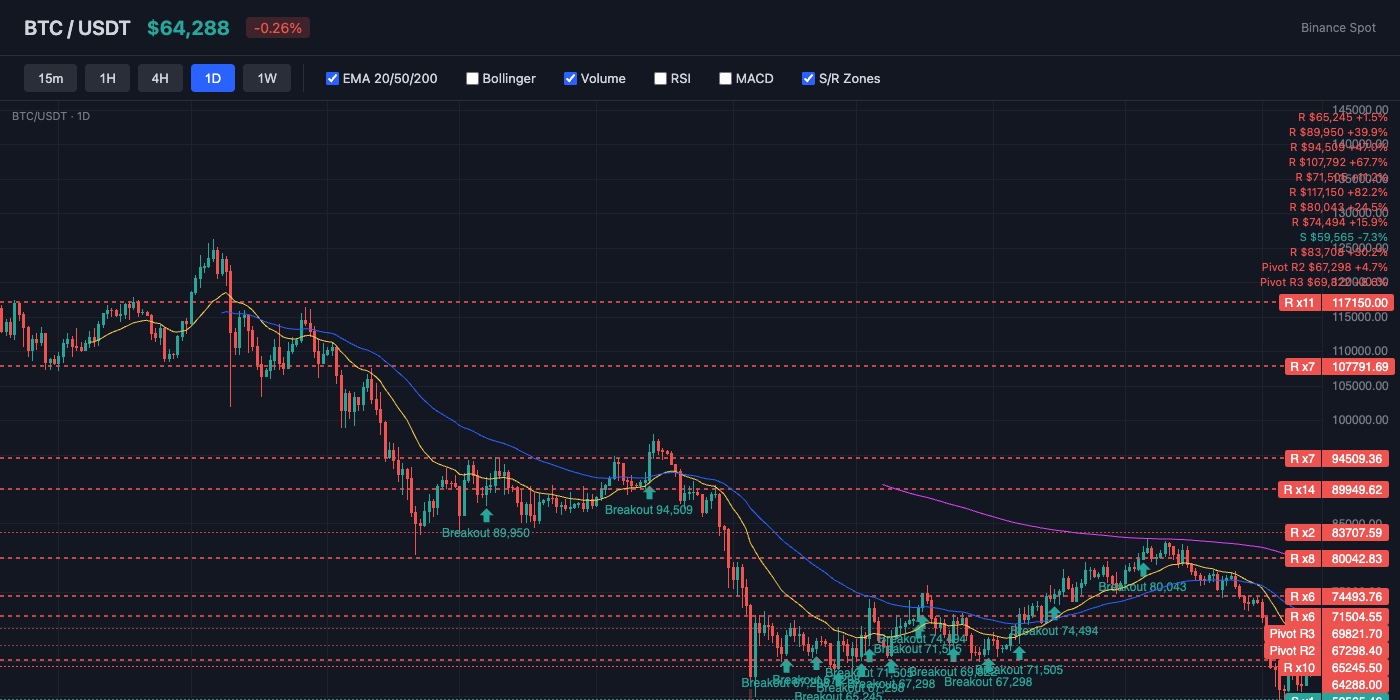
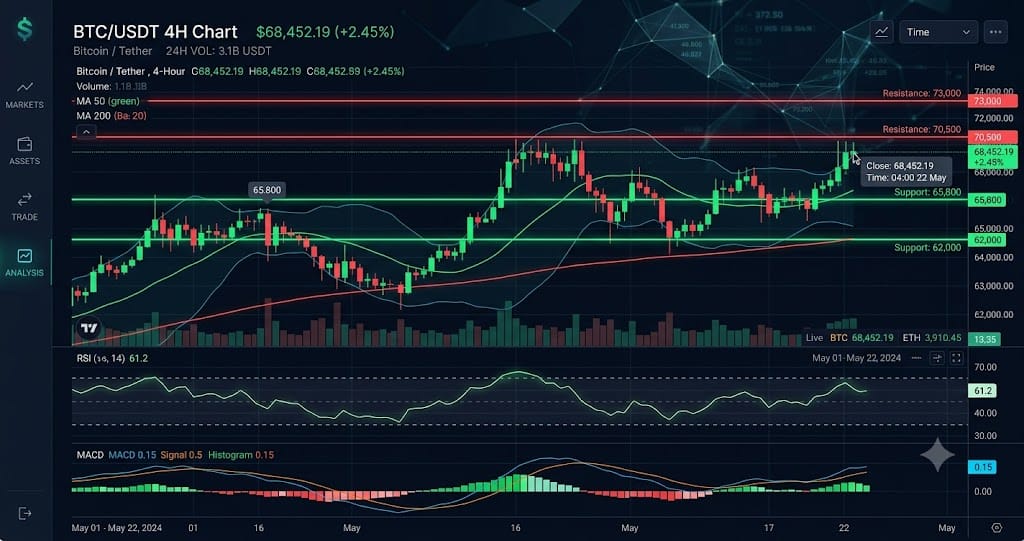
Bitcoin trades at $64,250, currently below the 20-day EMA ($67,064) and below the 50-day EMA ($70,840). The 200-day EMA at $81,173 serves as long-term resistance. Key resistance sits at $65,774 (Pivot R1), while support holds at $61,727 (Pivot S1). EMAs are stacked bearishly (20 < 50 < 200), indicating a sustained downtrend.
Bollinger Bands & Volatility
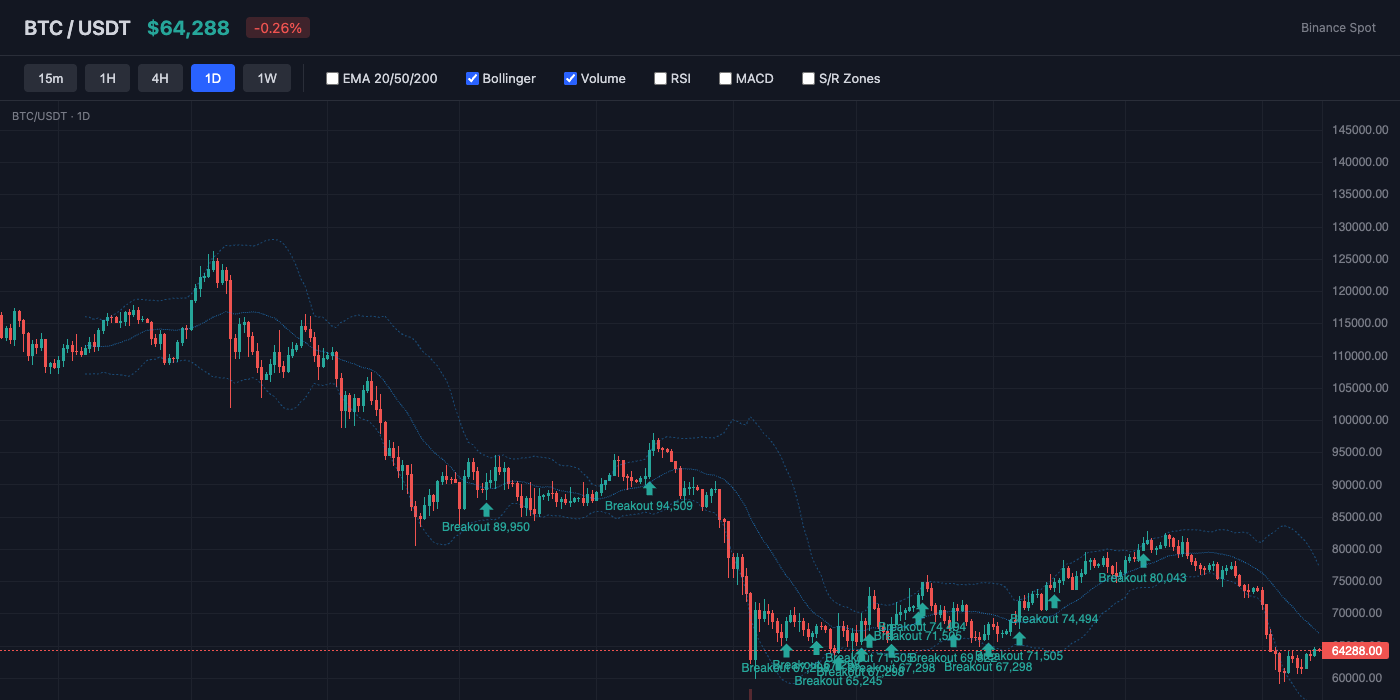
Bollinger Bands show a bandwidth of 32.0% (wide expansion — high volatility in play). Price is near the middle of the bands (%B: 37%), showing balanced positioning. The middle band (SMA 20) at $67,016 acts as dynamic resistance.
Momentum Indicators
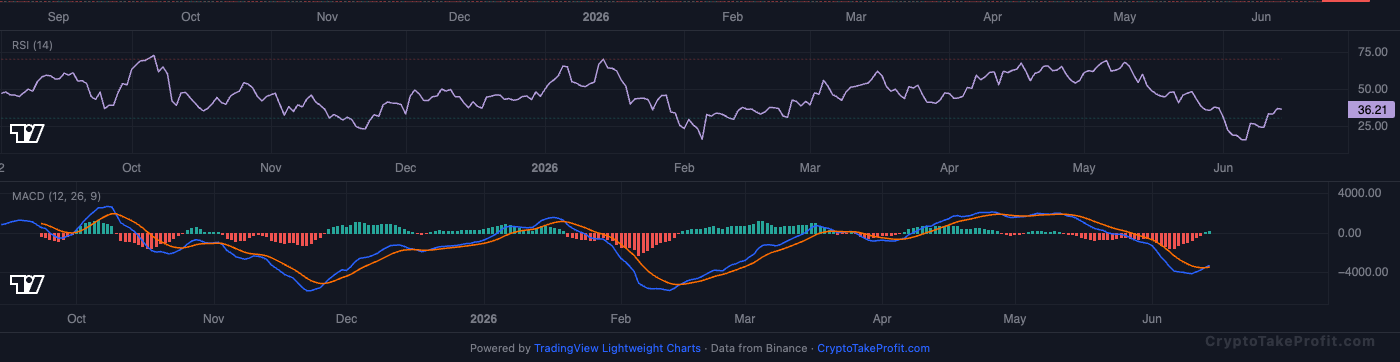
RSI reads 37.8, showing bearish pressure but approaching oversold. MACD shows a fresh bullish crossover, with positive histogram (172.90) indicating upward momentum.
Market Structure
BTC trades at $64,250 below EMA20 at $67,064 and EMA50 at $70,840, showing price is still under medium-term downtrend pressure as of June 14, 2026. RSI at 37.8 sits below neutral 50, indicating weak momentum despite MACD showing a positive histogram. Fear & Greed at 18 (Extreme Fear) signals defensive positioning across the market.
Volume Analysis
Volume ratio at 0.21x average confirms participation is extremely low relative to recent sessions as of June 14, 2026. This means the current move is not supported by strong conviction buying or selling. Open interest at 100,386 contracts with funding at -0.0054% shows slight short bias but no aggressive leverage build-up.
Key Levels
| Price | Type | Source | Significance | Distance |
|---|---|---|---|---|
| $70,840 | Resistance | EMA50 | Medium | +10.3% |
| $69,822 | Resistance | Pivot R3 | Low | +8.7% |
| $67,298 | Resistance | Pivot R2 | Medium | +4.7% |
| $65,774 | Resistance | Pivot R1 | Medium | +2.4% |
| $64,250 | Current | — | — | — |
| $61,727 | Support | Pivot S1 | Medium | -3.9% |
| $59,203 | Support | Pivot S2 | Medium | -7.9% |
| $57,679 | Support | Pivot S3 | Low | -10.2% |
| $56,289 | Support | BB Lower | Low | -12.4% |
Moving Averages
| MA | Value | Position | Signal |
|---|---|---|---|
| EMA 20 | $67,064 | Below | Bearish |
| EMA 50 | $70,840 | Below | Bearish |
| EMA 200 | $81,173 | Below | Bearish |
| BB Middle (SMA 20) | $67,016 | Below | Bearish |
Trade Setup
BTC Scenario Analysis
Bullish Case
Trigger: BTC breaks and closes above $65,774 with volume rising above 1.0x average
Target: $67,000–$69,500
Invalidation: sustained rejection below $64,000 with rising sell volume
Bull case requires reclaiming $65,774 to flip short-term structure. MACD positive histogram supports early momentum shift if volume returns.
Base Case
Trigger: BTC stays between $63,000 and $65,774 with volume below 0.8x average
Target: $63,000–$65,500
Invalidation: break above $65,774 or drop below $61,727 on high volume
Range forms because RSI at 37.8 and low volume show indecision. Price compresses between pivot support and resistance.
Bearish Case
Trigger: BTC loses $63,000 with rising open interest unwinding
Target: $61,727 then $60,500
Invalidation: strong reclaim of $65,000 with expanding volume
Bear case aligns with EMA rejection and extreme fear at 18. Weak volume increases downside fragility if support breaks.
Bitcoin (BTC) Resources
Altcoin Overview
Among altcoins, ETH leads with the strongest bullish signal (score: 2), while BNB shows the weakest setup (score: -40). Traders should focus on coins with clear directional signals and volume confirmation.
What to Watch
- BTC action around $64,250 for directional confirmation
- Fear & Greed at 18 for sentiment shift signals
- MACD crossover follow-through on top altcoins
- Volume confirmation on any support/resistance breaks
- BTC dominance at 56.6% for alt rotation signals