Crypto in Extreme Fear (17) — BTC at $62,769 Technical Analysis
Market Overview
The crypto market pulled back with total capitalization at $2.23T (-0.4%). BTC dominance sits at 56.2% while the Fear & Greed Index reads 17 (Extreme Fear), reflecting cautious sentiment.
Bitcoin (BTC) — $62,769
▲ WEAK BULLISH (Score: 2)
Price Action & Key Levels
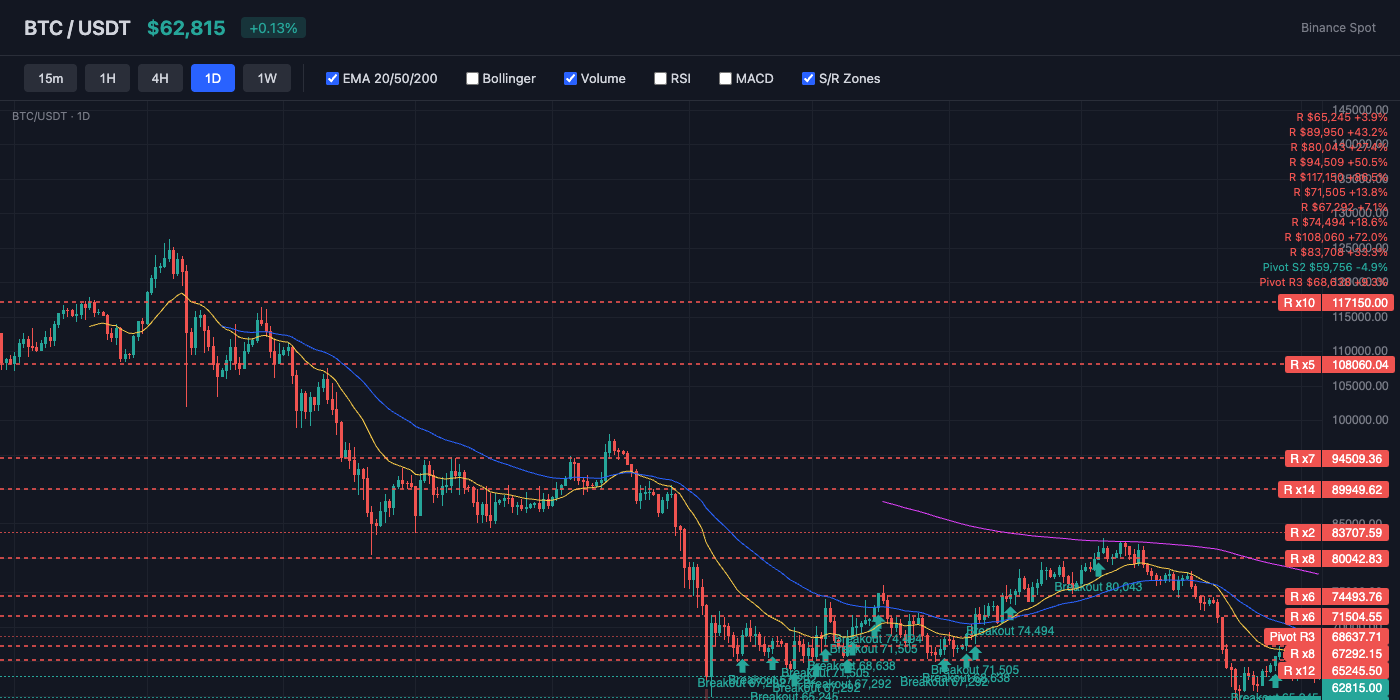
Bitcoin trades at $62,769, currently below the 20-day EMA ($65,108) and below the 50-day EMA ($68,637). The 200-day EMA at $79,670 serves as long-term resistance. Key resistance sits at $64,950 (Pivot R1), while support holds at $61,263 (Pivot S1). EMAs are stacked bearishly (20 < 50 < 200), indicating a sustained downtrend.
Bollinger Bands & Volatility
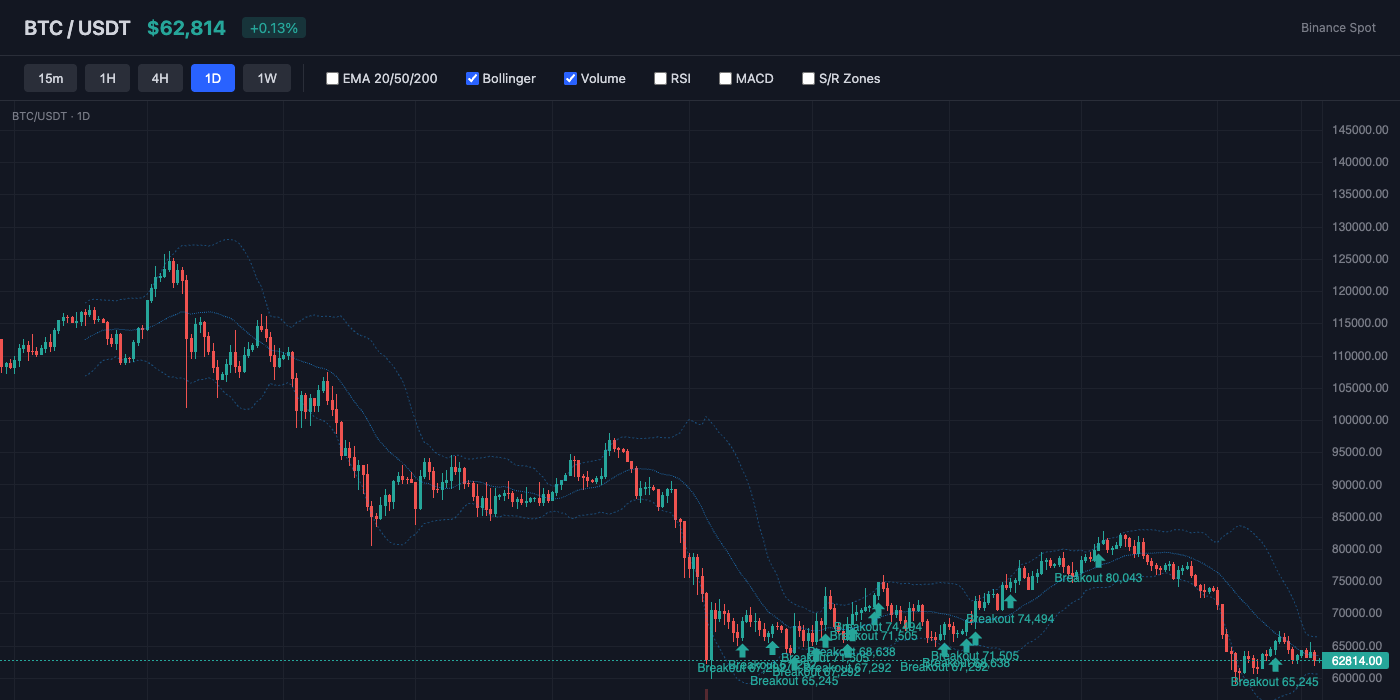
Bollinger Bands show a bandwidth of 10.7% (moderate volatility). Price is near the middle of the bands (%B: 40%), showing balanced positioning. The middle band (SMA 20) at $63,425 acts as dynamic resistance.
Momentum Indicators
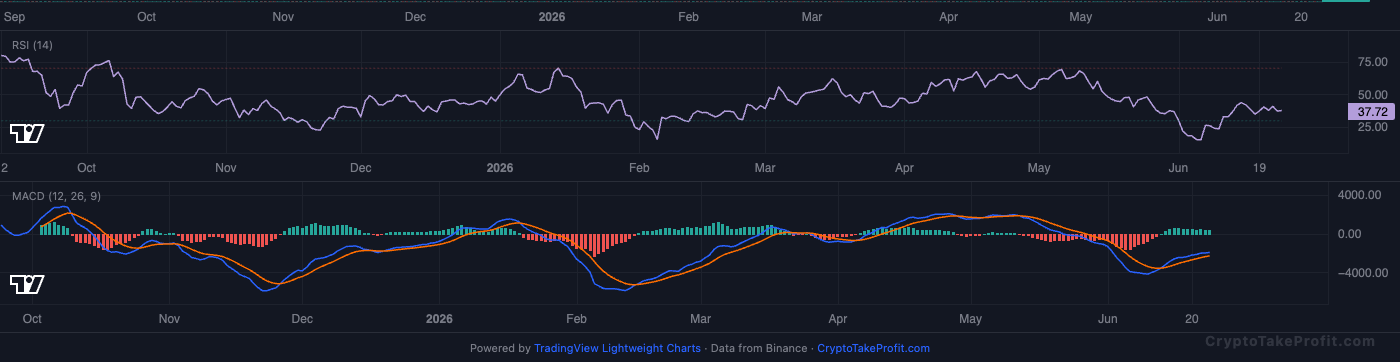
RSI reads 39.9, showing bearish pressure but approaching oversold. MACD has no active crossover, with positive histogram (361.00) indicating upward momentum.
Market Structure
BTC sits in a weak distribution phase with no confirmed trend, as market cap holds at $2.23T with a -0.4% daily change (CoinMarketCap data as of June 2026). Fear & Greed at 17 signals extreme fear, aligning with a defensive macro stance where buyers are cautious and momentum lacks conviction. Price action remains compressed between $61,263 support and $64,950 resistance.
Volume Analysis
Volume ratio at 0.31x average shows clear participation drop, confirming weak conviction from both buyers and sellers (Binance volume data as of June 2026). ATR at $2,237 indicates volatility is still present, but not supported by strong directional flow. This mismatch between volatility and participation suggests moves are more reactive than trend-driven.
Key Levels
| Price | Type | Source | Significance | Distance |
|---|---|---|---|---|
| $79,670 | Resistance | EMA200 | High | +26.9% |
| $68,638 | Resistance | Pivot R3 | Low | +9.3% |
| $67,131 | Resistance | Pivot R2 | Medium | +6.9% |
| $64,950 | Resistance | Pivot R1 | Medium | +3.5% |
| $62,769 | Current | — | — | — |
| $61,263 | Support | Pivot S1 | Medium | -2.4% |
| $59,756 | Support | Pivot S2 | Medium | -4.8% |
| $59,128 | Support | Swing Low | High | -5.8% |
| $57,575 | Support | Pivot S3 | Low | -8.3% |
Moving Averages
| MA | Value | Position | Signal |
|---|---|---|---|
| EMA 20 | $65,108 | Below | Bearish |
| EMA 50 | $68,637 | Below | Bearish |
| EMA 200 | $79,670 | Below | Bearish |
| BB Middle (SMA 20) | $63,425 | Below | Bearish |
Trade Setup
BTC Scenario Analysis
Bullish Case
Trigger: BTC breaks and holds above $64,950 resistance with volume ratio rising above 1.0x
Target: $67,200–$69,000 range
Invalidation: sustained rejection below $61,263 support
Bullish case requires participation returning alongside a clean breakout above resistance. A move through $64,950 would shift structure from compression to expansion.
Base Case
Trigger: BTC remains between $61,263 and $64,950 with volume staying below 0.8x average
Target: $61,500–$64,500 range
Invalidation: breakout above $64,950 or breakdown below $61,263
Base case reflects ongoing low-volume consolidation under extreme fear conditions. Market remains range-bound until participation increases.
Bearish Case
Trigger: breakdown below $61,263 with rising sell volume and OI drop from 97,739 contracts
Target: $58,000–$59,500 range
Invalidation: reclaim and hold above $64,950
Bearish scenario activates if support fails under low liquidity conditions. Extreme Fear at 17 increases risk of downside liquidity sweep.
Bitcoin (BTC) Resources
Altcoin Overview
Among altcoins, ADA leads with the strongest bullish signal (score: 7), while BNB shows the weakest setup (score: -30). Traders should focus on coins with clear directional signals and volume confirmation.
What to Watch
- BTC action around $62,769 for directional confirmation
- Fear & Greed at 17 for sentiment shift signals
- MACD crossover follow-through on top altcoins
- Volume confirmation on any support/resistance breaks
- BTC dominance at 56.2% for alt rotation signals