Crypto in Extreme Fear (12) — BTC at $61,732 Technical Analysis
Market Overview
The crypto market advanced with total capitalization at $0 (+0.0%). BTC dominance sits at 0.0% while the Fear & Greed Index reads 12 (Extreme Fear), reflecting cautious sentiment.
Bitcoin (BTC) — $61,732
▼ WEAK BEARISH (Score: -3)
Price Action & Key Levels
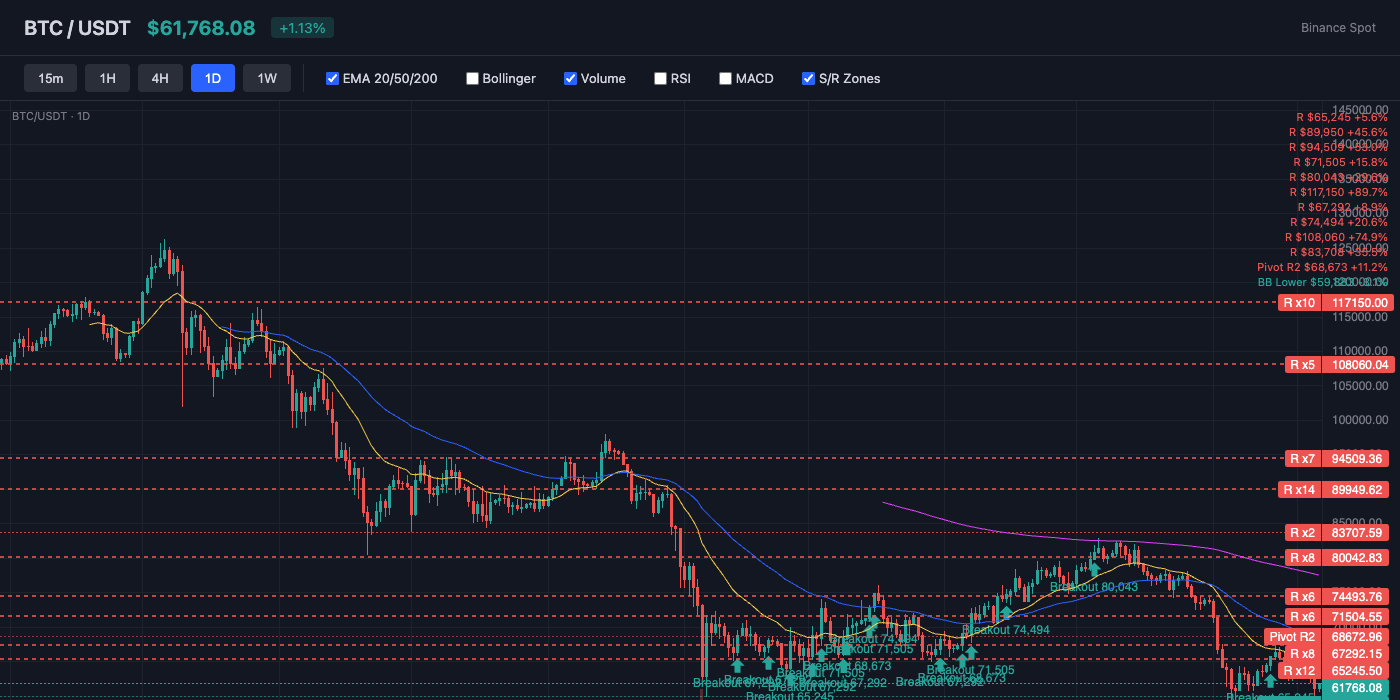
Bitcoin trades at $61,732, currently below the 20-day EMA ($64,392) and below the 50-day EMA ($68,272). The 200-day EMA at $79,477 serves as long-term resistance. Key resistance sits at $64,392 (EMA20), while support holds at $59,883 (BB Lower). EMAs are stacked bearishly (20 < 50 < 200), indicating a sustained downtrend.
Bollinger Bands & Volatility
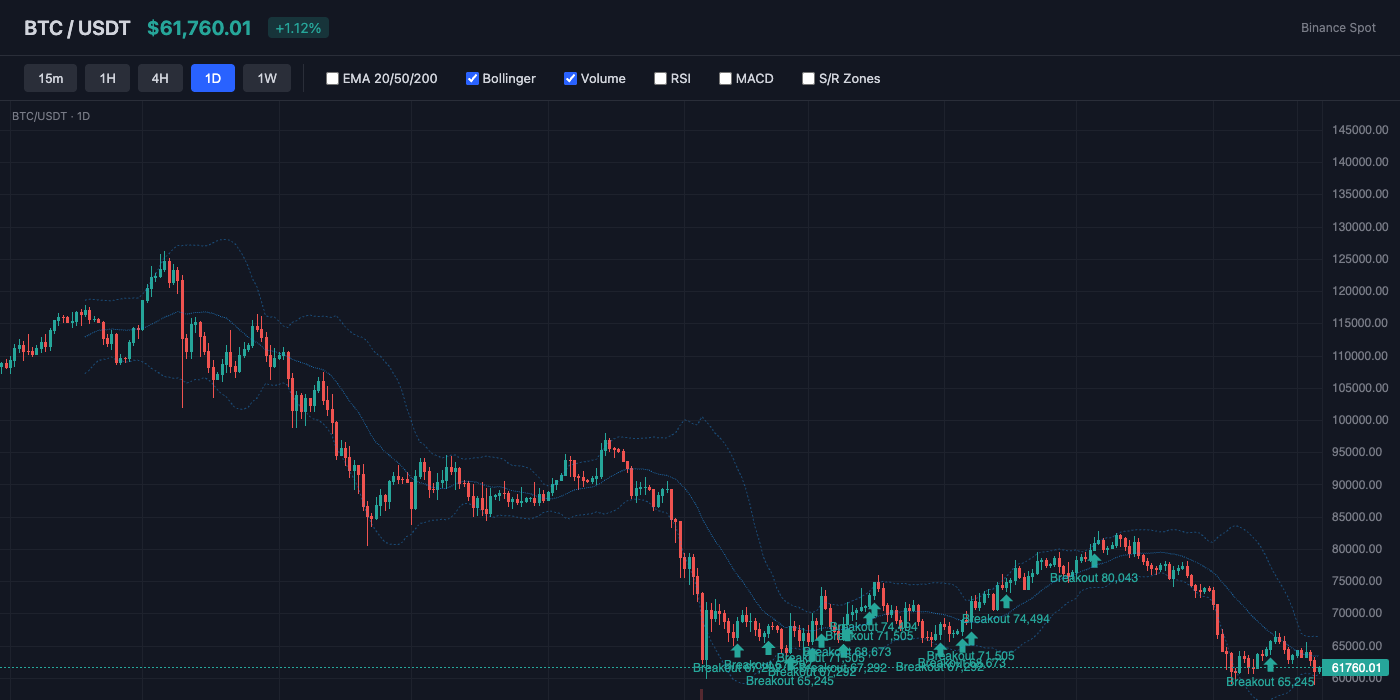
Bollinger Bands show a bandwidth of 11.0% (moderate volatility). Price is near the middle of the bands (%B: 27%), showing balanced positioning. The middle band (SMA 20) at $63,365 acts as dynamic resistance.
Momentum Indicators
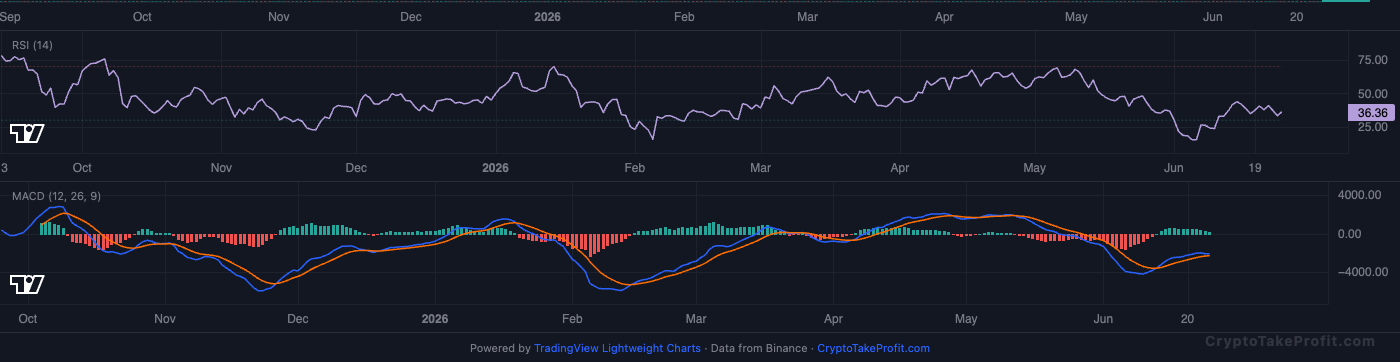
RSI reads 39.4, showing bearish pressure but approaching oversold. MACD has no active crossover, with positive histogram (166.40) indicating upward momentum.
Market Structure
BTC trades at $61,732 with price below EMA20 at $64,392 and EMA50 at $68,272, confirming a downtrend structure of -2.8% and -9.6% respectively. RSI at 39.4 sits below neutral 50, while Fear & Greed at 12 (Extreme Fear) reflects stressed sentiment conditions across the market.
Volume Analysis
Volume ratio at 1.06x average shows only mild participation, not strong breakout conviction. Short ratio at 1.10 indicates slightly more short positioning than long, which aligns with weak bearish pressure but not aggressive capitulation or squeeze conditions.
Key Levels
| Price | Type | Source | Significance | Distance |
|---|---|---|---|---|
| $68,673 | Resistance | Pivot R2 | Medium | +11.2% |
| $67,299 | Resistance | Swing High | High | +9.0% |
| $65,203 | Resistance | Pivot R1 | Medium | +5.6% |
| $64,392 | Resistance | EMA20 | Low | +4.3% |
| $61,732 | Current | — | — | — |
| $59,883 | Support | BB Lower | Low | -3.0% |
| $58,684 | Support | Pivot S1 | Medium | -4.9% |
| $55,635 | Support | Pivot S2 | Medium | -9.9% |
| $52,165 | Support | Pivot S3 | Low | -15.5% |
Moving Averages
| MA | Value | Position | Signal |
|---|---|---|---|
| EMA 20 | $64,392 | Below | Bearish |
| EMA 50 | $68,272 | Below | Bearish |
| EMA 200 | $79,477 | Below | Bearish |
| BB Middle (SMA 20) | $63,365 | Below | Bearish |
Trade Setup
BTC Scenario Analysis
Bullish Case
Trigger: BTC breaks above $64,392 EMA20 and holds for a daily close
Target: $68,272 EMA50 to $70,500 liquidity zone
Invalidation: break below $59,883 support
A bullish shift requires reclaiming $64,392, which is +4.3% from $61,732. If momentum expands, price rotates toward $68,272, about +10.6% upside from breakout level.
Base Case
Trigger: BTC remains between $59,883 support and $64,392 resistance
Target: $60,000 to $64,000 range compression
Invalidation: break above $64,392 or below $59,883
Sideways structure dominates if price stays inside a 7.3% range between $59,883 and $64,392. RSI near 39.4 and low volume expansion at 1.06x supports range-bound behavior.
Bearish Case
Trigger: BTC breaks below $59,883 Bollinger lower band support
Target: $57,500 then $55,000 liquidity zones
Invalidation: reclaim above $64,392 EMA20
Breakdown below $59,883 signals continuation of the -2.8% sub-EMA20 weakness. Extreme Fear at 12 increases downside continuation risk toward $55,000 if selling accelerates.
Bitcoin (BTC) Resources
Altcoin Overview
Among altcoins, ADA leads with the strongest bullish signal (score: 7), while BNB shows the weakest setup (score: -35). Traders should focus on coins with clear directional signals and volume confirmation.
What to Watch
- BTC action around $61,732 for directional confirmation
- Fear & Greed at 12 for sentiment shift signals
- MACD crossover follow-through on top altcoins
- Volume confirmation on any support/resistance breaks
- BTC dominance at 0.0% for alt rotation signals