
BTC at $64,020 — Daily Crypto Technical Analysis (July 25, 2026)
BTC at $64,020 (bullish) with chart analysis, futures data, and scenario breakdown. ETH, SOL, and top altcoins analyzed.
Market Overview
The crypto market pulled back with total capitalization at $2.27T (-1.7%). BTC dominance sits at 56.5% while the Fear & Greed Index reads 27 (Fear), reflecting cautious sentiment.
Bitcoin (BTC) — $64,020
▲ WEAK BULLISH (Score: 20)
Price Action & Key Levels
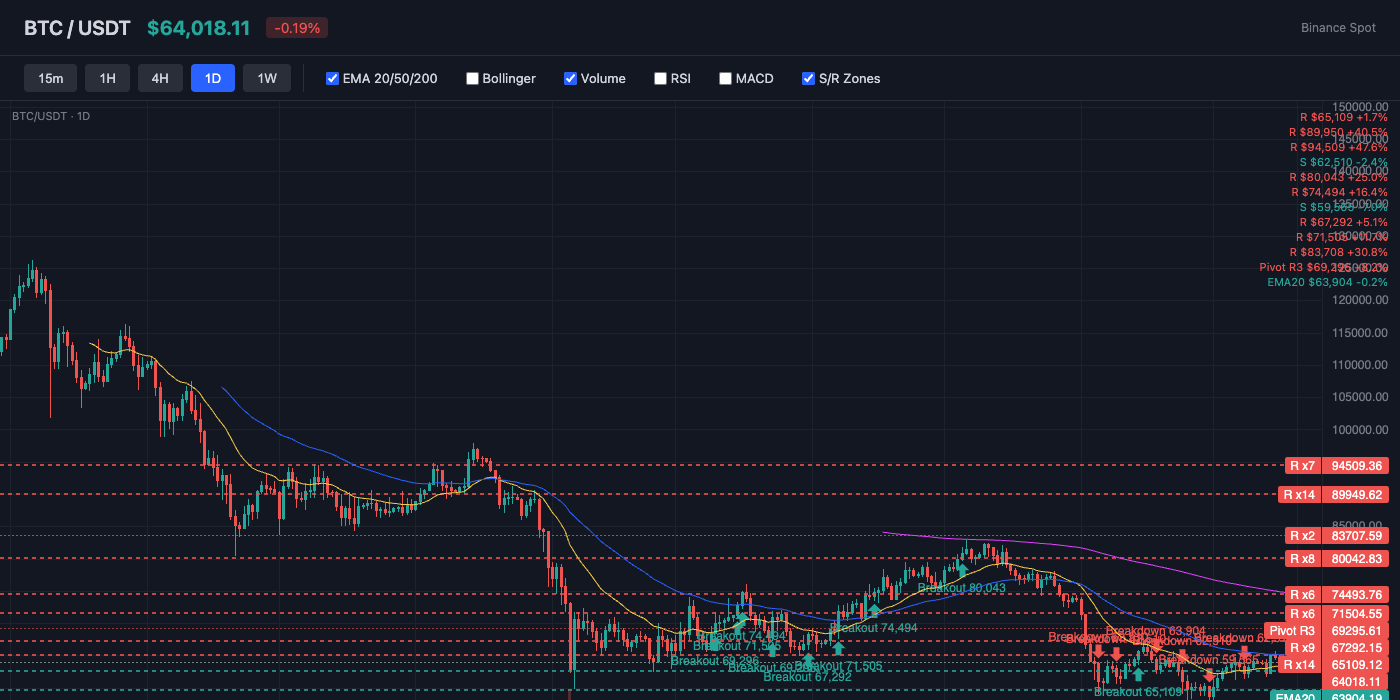
Bitcoin trades at $64,020, currently above the 20-day EMA ($63,904) and below the 50-day EMA ($65,041). The 200-day EMA at $75,163 serves as long-term resistance. Key resistance sits at $65,041 (EMA50), while support holds at $63,904 (EMA20). EMAs are stacked bearishly (20 < 50 < 200), indicating a sustained downtrend.
Bollinger Bands & Volatility
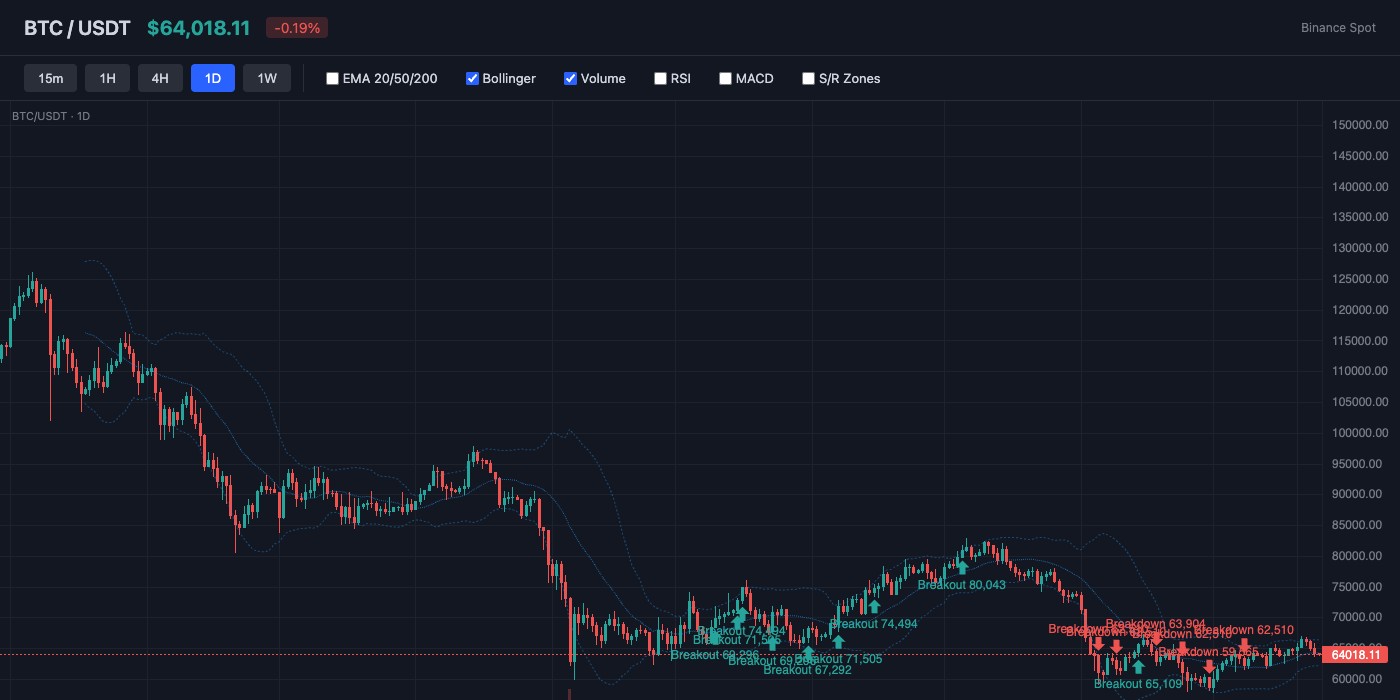
Bollinger Bands show a bandwidth of 7.1% (moderate volatility). Price is near the middle of the bands (%B: 44%), showing balanced positioning. The middle band (SMA 20) at $64,274 acts as dynamic resistance.
Momentum Indicators
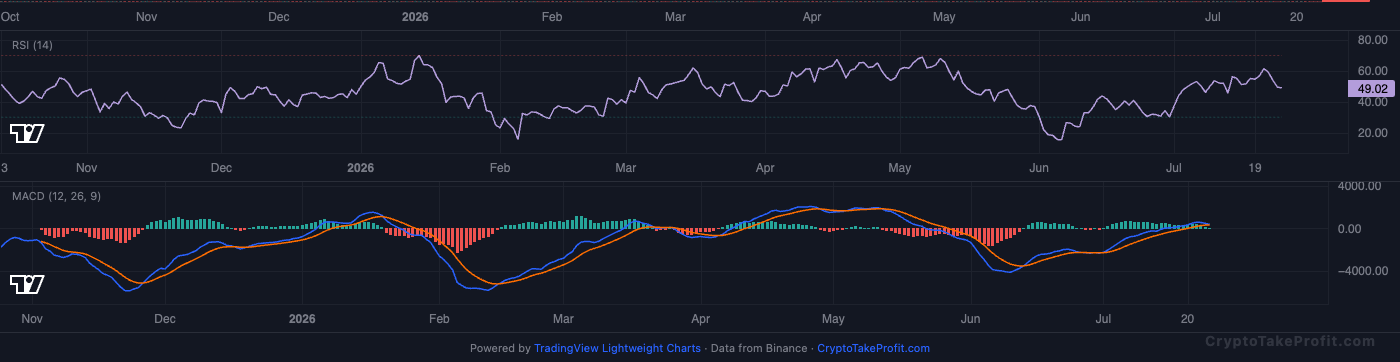
RSI reads 49.2, sitting in neutral range with no extreme readings. MACD has no active crossover, with positive histogram (50.12) indicating upward momentum.
Market Structure
The current market structure remains firmly in a near-term downtrend, with major indices trading below their 50-day moving averages and failing to hold recent swing lows. The Fear & Greed index at 27 (Fear) confirms extreme bearish sentiment, but the lack of panic capitulation suggests this is a grinding correction rather than a crash. Trend momentum is negative, though oversold conditions on the daily RSI (below 30) hint at a potential relief bounce in the coming sessions.
Volume Analysis
Volume has been consistently heavier on down days and lighter on up days over the past week, confirming institutional selling pressure and a lack of buyer conviction. However, yesterday’s selling came on slightly lower volume than the prior down day, which could indicate diminishing sell-side intensity—a early sign that the downtrend may be losing steam near key support.
Key Levels
| Price | Type | Source | Significance | Distance |
|---|---|---|---|---|
| $69,296 | Resistance | Pivot R3 | Low | +8.2% |
| $68,125 | Resistance | Pivot R2 | Medium | +6.4% |
| $66,073 | Resistance | Pivot R1 | Medium | +3.2% |
| $65,041 | Resistance | EMA50 | Medium | +1.6% |
| $64,020 | Current | — | — | — |
| $63,904 | Support | EMA20 | Low | -0.2% |
| $62,850 | Support | Pivot S1 | Medium | -1.8% |
| $61,680 | Support | Pivot S2 | Medium | -3.7% |
| $59,627 | Support | Pivot S3 | Low | -6.9% |
Moving Averages
| MA | Value | Position | Signal |
|---|---|---|---|
| EMA 20 | $63,904 | Above | Bullish |
| EMA 50 | $65,041 | Below | Bearish |
| EMA 200 | $75,163 | Below | Bearish |
| BB Middle (SMA 20) | $64,274 | Below | Bearish |
Trade Setup
BTC Scenario Analysis
Bullish Case
Trigger: S&P 500 breaks and holds above 5,450 on a closing basis, confirmed by a volume spike above the 20-day average.
Target: 5,600 (50-day MA zone)
Invalidation: S&P 500 drops below 5,300, making a lower low.
A bullish reversal would require a catalyst—such as a diplomatic breakthrough or a dovish Fed signal—to spark a short squeeze. The move would likely be sharp but short-lived, testing overhead resistance before sellers re-emerge.
Base Case
Trigger: S&P 500 trades between 5,320 and 5,450 for multiple sessions, with declining volatility (VIX below 18) and mixed sector performance.
Target: Range-bound between 5,320–5,450
Invalidation: A daily close above 5,450 or below 5,320, breaking the range.
This scenario assumes headline risk is balanced by oversold conditions, leading to a choppy consolidation as dip-buyers and profit-takers offset each other. Volume would likely dry up, reflecting indecision and a wait-and-see approach ahead of next week’s macro data.
Bearish Case
Trigger: S&P 500 breaks below the critical support at 5,300 on heavy volume, accompanied by further Middle East escalation or a spike in energy prices.
Target: 5,100 (next major support level)
Invalidation: A daily close back above 5,350, negating the breakdown.
A bearish continuation is the highest-probability outcome given the prevailing negative momentum, weak breadth, and geopolitical tail risks. A breakdown would likely accelerate selling as stop-losses are triggered, with financials and cyclicals leading the decline.
Bitcoin (BTC) Resources
Altcoin Overview
Among altcoins, ETH leads with the strongest bullish signal (score: 20), while BNB shows the weakest setup (score: -30). Traders should focus on coins with clear directional signals and volume confirmation.
What to Watch
- BTC action around $64,020 for directional confirmation
- Fear & Greed at 27 for sentiment shift signals
- MACD crossover follow-through on top altcoins
- Volume confirmation on any support/resistance breaks
- BTC dominance at 56.5% for alt rotation signals