Ethereum (ETH) Interactive Chart Analysis — July 17, 2026
ETH at $1,832 — interactive chart with EMA, BB, RSI, MACD, S/R levels. WEAK bullish signal (25). Funding rate 0.0042%.
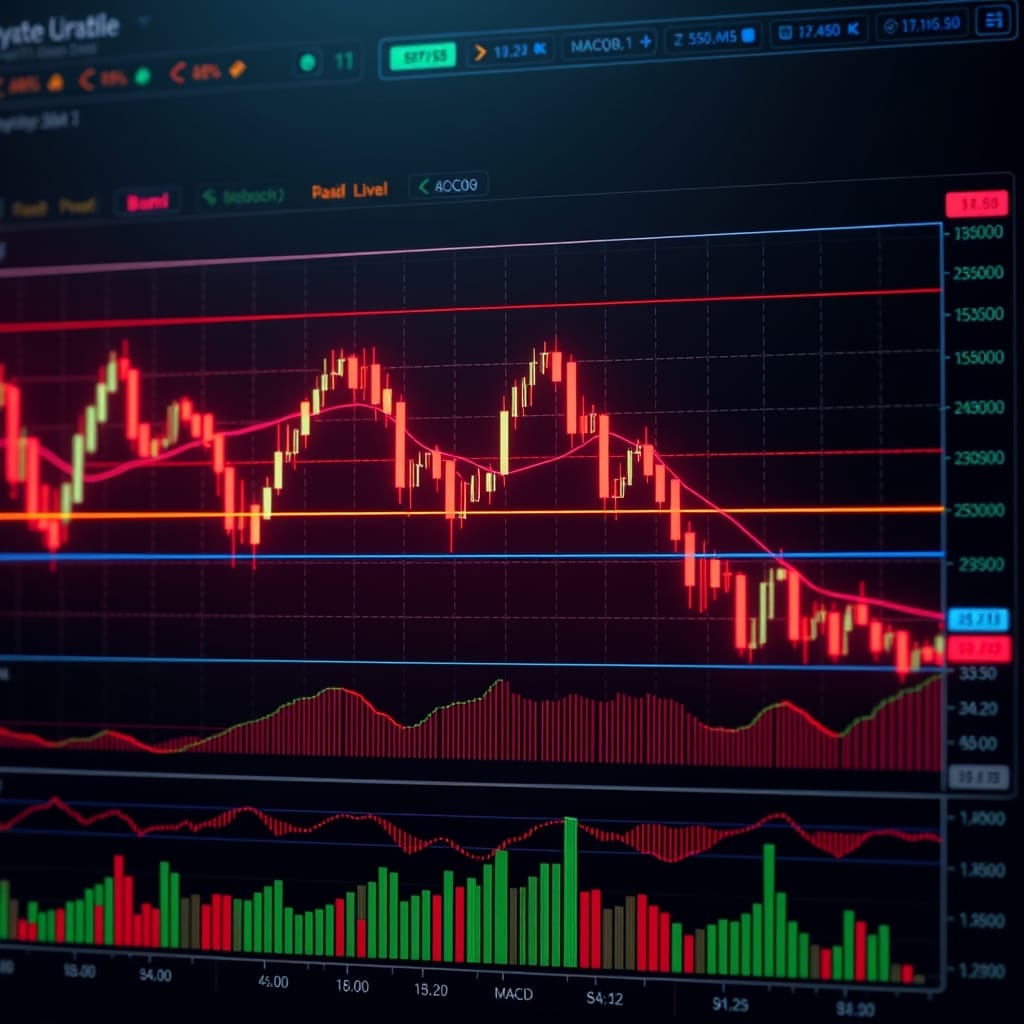
Interactive chart — switch timeframes, toggle indicators, hover for OHLC data
Market Structure
ETH trades at $1,832, above both the EMA20 ($1,775) and EMA50 ($1,812), with the 50-day acting as immediate support. The RSI at 54.7 sits in neutral territory, while the positive MACD histogram and a BB %B of 68.9% indicate upside momentum but not overbought conditions. The signal score of 25 (WEAK bullish) suggests conviction is low, and the price has consolidated between $1,812 and $1,935 for the past 72 hours.
Key Levels
| Price | Type | Source | Significance | Distance |
|---|---|---|---|---|
| $2,132 | Resistance | Pivot R3 | Low | +16.4% |
| $2,039 | Resistance | Pivot R2 | Medium | +11.3% |
| $1,957 | Resistance | BB Upper | Low | +6.8% |
| $1,935 | Resistance | Pivot R1 | Medium | +5.7% |
| $1,832 | Current | — | — | — |
| $1,812 | Support | EMA50 | Medium | -1.1% |
| $1,775 | Support | EMA20 | Low | -3.1% |
| $1,739 | Support | Pivot S1 | Medium | -5.1% |
| $1,647 | Support | Pivot S2 | Medium | -10.1% |
Moving Averages
| MA | Value | Position | Signal |
|---|---|---|---|
| EMA 20 | $1,775 | Above | Bullish |
| EMA 50 | $1,812 | Above | Bullish |
| EMA 200 | $2,310 | Below | Bearish |
| BB Middle (SMA 20) | $1,756 | Above | Bullish |
Volume Analysis
Volume ratio at 0.92x average means current turnover is slightly below normal, confirming a lack of aggressive new buyers or sellers. This low participation supports a range-bound market rather than a breakout, and the 0.0042% funding rate is near zero, indicating no speculative excess in perpetuals. Open interest of 2.31 million contracts with a long/short ratio of 1.43 shows traders lean long, but without volume confirmation, that positioning is vulnerable.
Technical Indicators
Trade Setup
Scenario Analysis
Bullish Case
Trigger: ETH closes a 4-hour candle above $1,875 with volume exceeding 1.2x average.
Target: $1,935 (Pivot R1), then $2,010 (next resistance from May 2026 highs).
Invalidation: price drops back below $1,812 (EMA50) within the next 12 hours.
A volume-backed move through $1,875 would break the consolidation and target the first major resistance. RSI room to 70 and positive histogram support this, but the low volume ratio makes this the least likely outcome without a catalyst.
Base Case
Trigger: price oscillates between $1,812 and $1,875 with volume staying below 1.0x average.
Target: $1,820–$1,870 range by July 19, 2026 (today).
Invalidation: a 4-hour close above $1,875 or below $1,812.
With neutral RSI, flat funding, and below-average volume, ETH is likely to chop inside the EMA50 support and the mid-range pivot. Open interest remains elevated, but longs lack momentum to force a squeeze, so sideways action is the highest-probability outcome for the next 24 hours.
Bearish Case
Trigger: price breaks and closes below $1,812 (EMA50) on the 4-hour chart with volume above 1.1x average.
Target: $1,740 (previous support from July 14), then $1,675 (200-day EMA).
Invalidation: price recovers above $1,830 within two consecutive 4-hour candles.
A breakdown below the 50-day would flip support to resistance and trigger long liquidations given the 1.43 long/short ratio. The ATR of $74.88 implies a potential daily move of $150, so a $1,812 breach could quickly reach $1,740, with the low volume making a swift drop more violent if sellers appear.
Analysis Summary
Ethereum (ETH) Resources