Ethereum (ETH) Interactive Chart Analysis — July 29, 2026
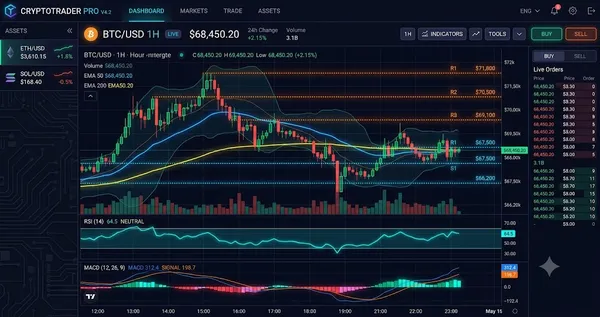
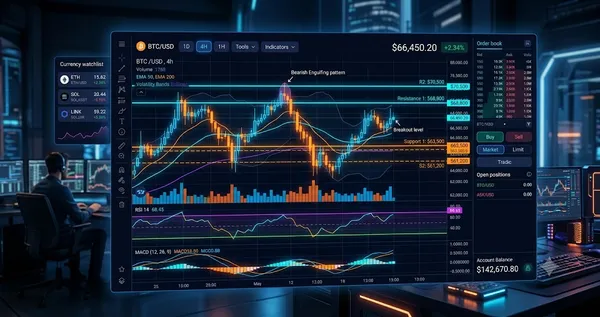
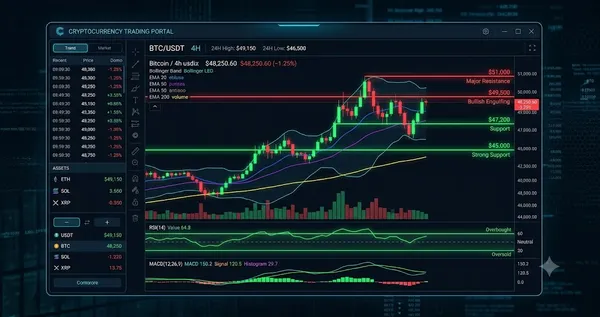
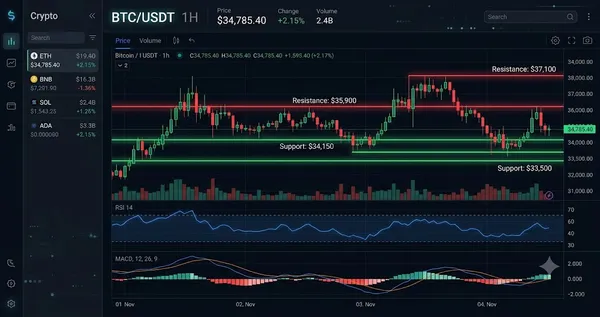
ETH at $1,917 — interactive chart with EMA, BB, RSI, MACD, S/R levels. MODERATE bullish signal (40). Funding rate 0.0096%.
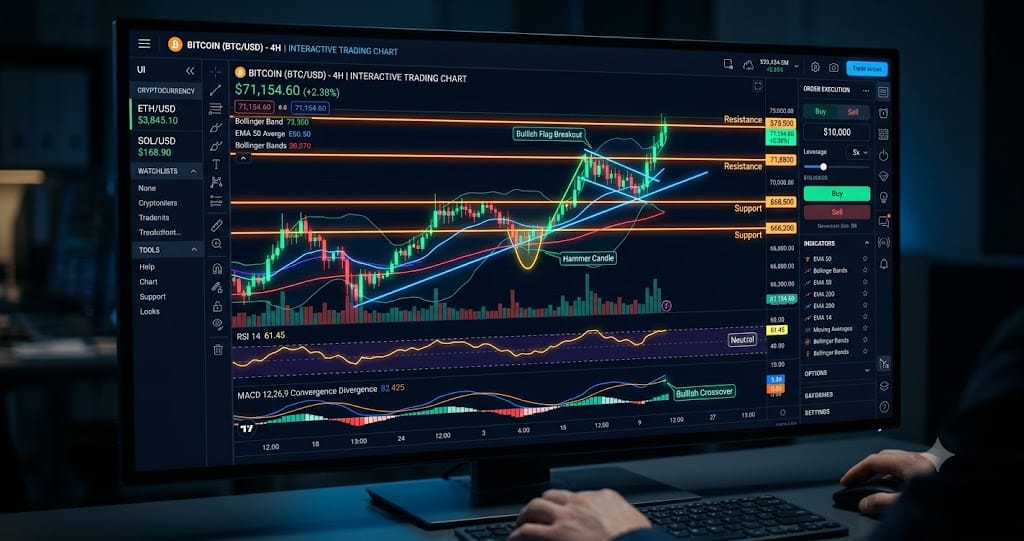
Interactive chart — switch timeframes, toggle indicators, hover for OHLC data
Market Structure
Price holds at $1,917, above both EMA20 ($1,863) and EMA50 ($1,846). RSI at 58.3 and a positive MACD histogram point to modest upside pressure. Yet the ATR of $65.97 implies daily moves of roughly $66, so the current range is narrow.
Key Levels
| Price | Type | Source | Significance | Distance |
|---|---|---|---|---|
| $2,250 | Resistance | EMA200 | High | +17.4% |
| $2,113 | Resistance | Pivot R3 | Low | +10.2% |
| $2,047 | Resistance | Pivot R2 | Medium | +6.8% |
| $1,982 | Resistance | Pivot R1 | Medium | +3.4% |
| $1,917 | Current | — | — | — |
| $1,851 | Support | Pivot S1 | Medium | -3.4% |
| $1,786 | Support | Pivot S2 | Medium | -6.8% |
| $1,721 | Support | Pivot S3 | Low | -10.2% |
Moving Averages
| MA | Value | Position | Signal |
|---|---|---|---|
| EMA 20 | $1,863 | Above | Bullish |
| EMA 50 | $1,846 | Above | Bullish |
| EMA 200 | $2,250 | Below | Bearish |
| BB Middle (SMA 20) | $1,876 | Above | Bullish |
Volume Analysis
Volume ratio sits at 0.77x the average, meaning today’s turnover is 23% lighter than normal. That weak participation casts doubt on the rally’s stamina. Price advances on shrinking volume typically precede reversals or consolidation.
Technical Indicators
Trade Setup
Scenario Analysis
Bullish Case
Trigger: Daily close above $1,982 (Pivot R1) with volume ratio rising above 1.2x.
Target: $2,050 (measured move from breakout).
Invalidation: Rejection below $1,920 and RSI rolling under 55.
A confirmed breakout clears the only nearby resistance and would open room toward $2,050. Funding at 0.0096% remains low, so a short squeeze could add fuel if longs add positions.
Base Case
Trigger: Price oscillates between $1,851 support and $1,982 resistance over the next 48 hours.
Target: Range-bound trade, with daily closes inside $1,870–$1,950.
Invalidation: A 4‑hour candle closes below $1,851 or above $1,982.
Below‑average volume and a neutral RSI favour sideways churn. Open Interest at 2,293,978 contracts and a Long/Short ratio of 1.34 show crowded longs, which caps upside without fresh buyers.
Bearish Case
Trigger: Break and 4‑hour close below $1,851 (Pivot S1).
Target: $1,800 (next psychological level, 3.6% lower).
Invalidation: Price reclaims $1,880 within two hours of the breakdown.
A support break would expose the $1,800 area, especially with volume already anemic. The 0.77x volume ratio means even a modest selling wave could accelerate downside, as bids are thin. Open Interest at 2.29 million contracts suggests leveraged longs would unwind sharply on a breach.
Analysis Summary
Ethereum (ETH) Resources