
Ethereum (ETH) Interactive Chart Analysis — July 31, 2026
ETH at $1,891 — interactive chart with EMA, BB, RSI, MACD, S/R levels. WEAK bullish signal (5). Funding rate -0.0005%.
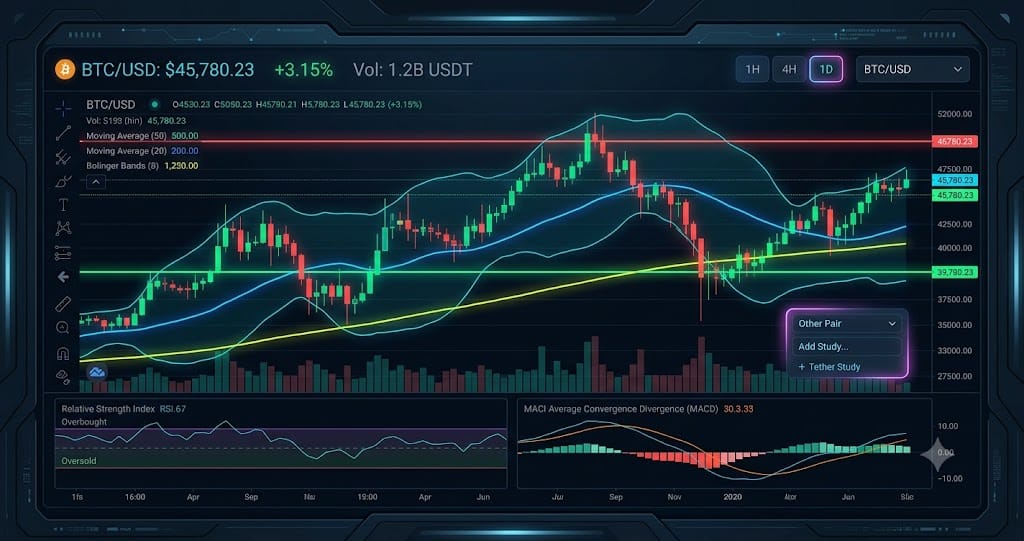
Interactive chart — switch timeframes, toggle indicators, hover for OHLC data
Market Structure
Price is above its short-term EMAs, indicating a fragile uptrend since the last local low near $1,850. RSI at 54.0 stays below overbought, leaving room for upside, but the negative MACD histogram contradicts that move. Resistance sits clearly at $1,963 (Pivot R1), while support rests at the EMA20 of $1,871, per the provided indicator set.
Key Levels
| Price | Type | Source | Significance | Distance |
|---|---|---|---|---|
| $2,239 | Resistance | EMA200 | High | +18.4% |
| $2,089 | Resistance | Pivot R3 | Low | +10.5% |
| $2,035 | Resistance | Pivot R2 | Medium | +7.7% |
| $1,963 | Resistance | Pivot R1 | Medium | +3.8% |
| $1,891 | Current | — | — | — |
| $1,871 | Support | EMA20 | Low | -1.0% |
| $1,837 | Support | Pivot S1 | Medium | -2.8% |
| $1,784 | Support | Pivot S2 | Medium | -5.6% |
| $1,712 | Support | Pivot S3 | Low | -9.5% |
Moving Averages
| MA | Value | Position | Signal |
|---|---|---|---|
| EMA 20 | $1,871 | Above | Bullish |
| EMA 50 | $1,850 | Above | Bullish |
| EMA 200 | $2,239 | Below | Bearish |
| BB Middle (SMA 20) | $1,885 | Above | Bullish |
Volume Analysis
Volume ratio at 0.50x average confirms absent buying conviction, according to the given data. Rallies on half-normal volume typically fail without a surge in participation. Current turnover does not support a breakout above $1,963.
Technical Indicators
Trade Setup
Scenario Analysis
Bullish Case
Trigger: Price breaks above $1,963 with volume ratio exceeding 1.0x.
Target: $2,050 (next psychological resistance based on ATR of $63.61).
Invalidation: Price closes below $1,871 (EMA20) on any volume.
A volume-backed push through R1 would open the $2,050 zone. The weak signal (5) and neutral RSI allow upside, but only if buyers step in.
Base Case
Trigger: Price holds between $1,871 and $1,963 over the next 48 hours.
Target: Range-bound trading from $1,871 to $1,963, with $1,917 as the midpoint (BB %B at 53.3% near middle).
Invalidation: A daily close above $1,963 or below $1,871.
Low volume and flat momentum favor consolidation within the Bollinger bands. Open interest at 2,320,167 contracts remains stable, suggesting neither side forces a liquidation cascade.
Bearish Case
Trigger: Price breaks below $1,871 (EMA20) with volume ratio rising above 0.8x.
Target: $1,800, the next support level inferred from a 1x ATR move below EMA20.
Invalidation: Price recovers above $1,891 within the same trading session.
Negative MACD histogram and negative funding (-0.0005%) despite a 1.30 long/short ratio point to underlying weakness. A break of the EMA20 would confirm sellers controlling the session, with volume accelerating to 0.8x average as the key confirmation.
Analysis Summary
Ethereum (ETH) Resources