
Ethereum (ETH) Interactive Chart Analysis — August 30, 2026
ETH at $2,457 — interactive chart with EMA, BB, RSI, MACD, S/R levels. WEAK bullish signal (20). Funding rate 0.0035%.
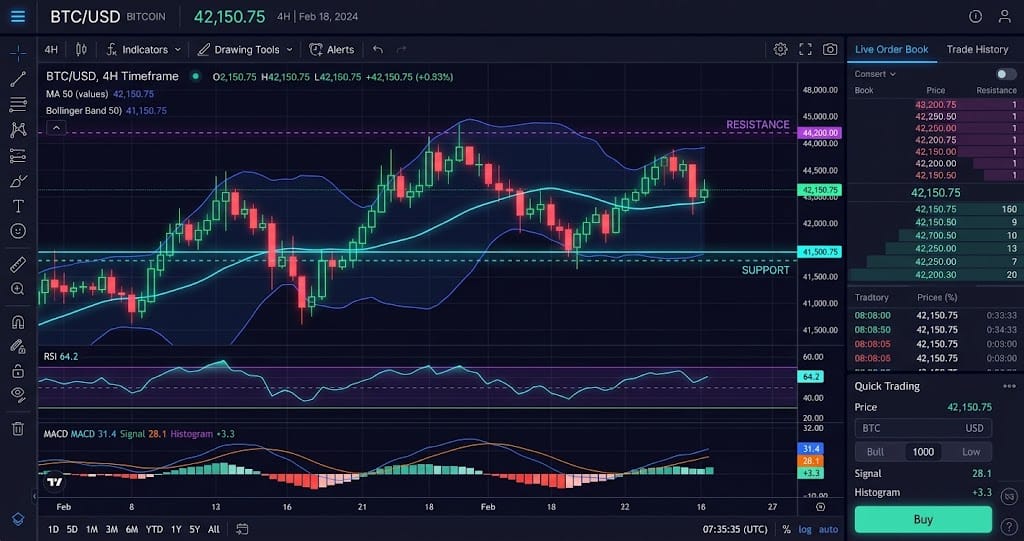
Interactive chart — switch timeframes, toggle indicators, hover for OHLC data
Market Structure
Ethereum trades at $2,457, which is 8.6% above the EMA50 of $2,081 and 6.3% above the EMA20 of $2,262 per the provided data. The RSI at 74.5 signals overbought conditions on the daily timeframe, while the positive MACD histogram confirms upward momentum but lacks a clear MACD line cross. Price sits just 3.7% below the pivot resistance at $2,547, with the pivot support at $2,387 acting as the immediate floor as of August 30, 2026.
Key Levels
| Price | Type | Source | Significance | Distance |
|---|---|---|---|---|
| $2,746 | Resistance | BB Upper | Low | +11.8% |
| $2,707 | Resistance | Pivot R3 | Low | +10.2% |
| $2,637 | Resistance | Pivot R2 | Medium | +7.3% |
| $2,547 | Resistance | Pivot R1 | Medium | +3.7% |
| $2,457 | Current | — | — | — |
| $2,387 | Support | Pivot S1 | Medium | -2.9% |
| $2,316 | Support | Pivot S2 | Medium | -5.7% |
| $2,262 | Support | EMA20 | Low | -7.9% |
| $2,226 | Support | Pivot S3 | Low | -9.4% |
Moving Averages
| MA | Value | Position | Signal |
|---|---|---|---|
| EMA 20 | $2,262 | Above | Bullish |
| EMA 50 | $2,081 | Above | Bullish |
| EMA 200 | $2,164 | Above | Bullish |
| BB Middle (SMA 20) | $2,204 | Above | Bullish |
Volume Analysis
Volume ratio stands at 0.22x average, indicating that current trading volume is only 22% of the typical 24-hour level, per the data supplied. This extreme thinness undermines the bullish signal reading of 20, as low participation near resistance generally suggests limited buying conviction. A breakout above $2,547 would require volume to at least double, but current flows do not support that outcome.
Technical Indicators
Trade Setup
Scenario Analysis
Bullish Case
Trigger: 4-hour candle close above $2,547 with volume ratio exceeding 1.5x average.
Target: $2,720 (1.618 Fibonacci extension of the $2,387–$2,547 range).
Invalidation: Price falls back below $2,387 support within 24 hours of the trigger.
A volume-confirmed break above resistance would override the overbought RSI, as momentum often accelerates in low-liquidity environments once shorts cover. With funding rate at 0.0035% and long/short ratio at 1.64, a short squeeze could push price 6.7% higher to $2,720.
Base Case
Trigger: Price remains within $2,387 and $2,547 over the next 4 trading sessions with volume ratio staying below 0.8x.
Target: Range-bound trade between $2,387 (S1) and $2,547 (R1), with a midpoint near $2,467.
Invalidation: A 4-hour close above $2,547 or below $2,387.
The overbought RSI of 74.5 and volume at 0.22x average create a classic consolidation pattern, while open interest of 2.37 million contracts suggests passive positioning with no directional urgency. The ATR of $80.33 implies daily swings of roughly ±$80, which keeps price trapped inside the pivot band without a catalyst.
Bearish Case
Trigger: 4-hour close below $2,387 support, confirmed by volume ratio increasing above 0.8x on the breakdown bar.
Target: $2,250 (confluence of the EMA20 at $2,262 and the psychological round number).
Invalidation: Price reclaims $2,547 on volume before hitting the target.
A break below pivot support exposes the EMA20 at $2,262, as the weak bullish signal of 20 cannot offset the overbought RSI and vanishing volume. The long/short ratio at 1.64 indicates overcrowded longs; a flush could liquidate positions and accelerate the 8.4% drop toward $2,250.
Analysis Summary
Ethereum (ETH) Resources