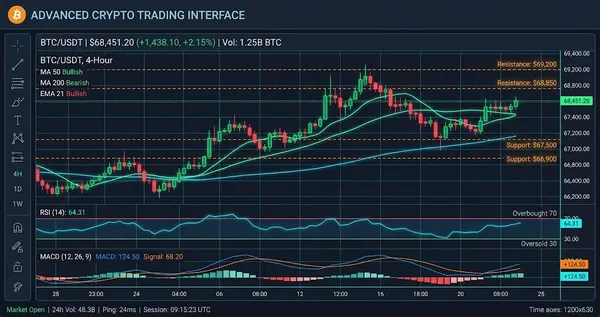
Ethereum (ETH) Interactive Chart Analysis — September 12, 2026
ETH at $2,534 — interactive chart with EMA, BB, RSI, MACD, S/R levels. WEAK bearish signal (-7). Funding rate 0.0024%.
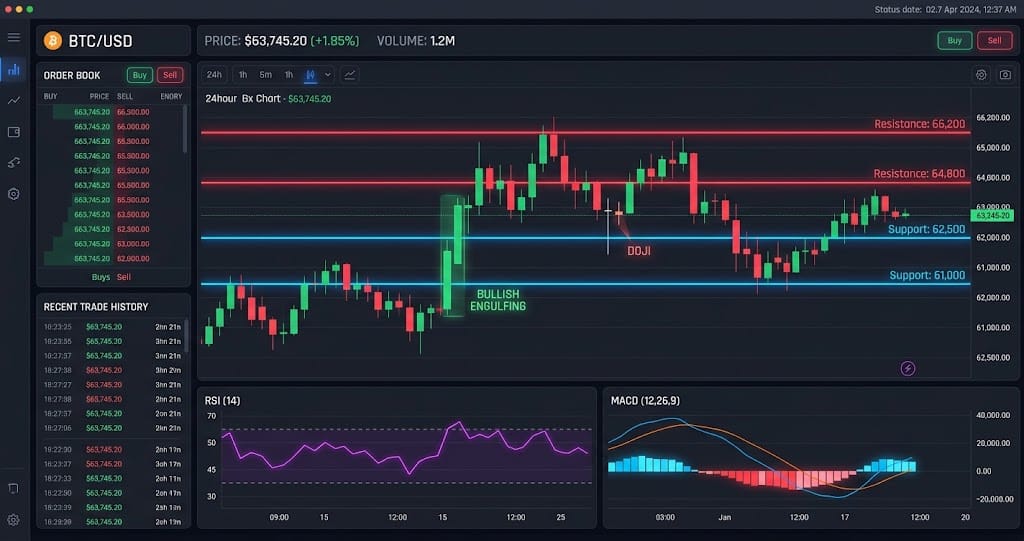
Interactive chart — switch timeframes, toggle indicators, hover for OHLC data
Market Structure
ETH is trading at $2,534 as of September 12, 2026, above the $2,419 EMA20 and $2,244 EMA50, preserving a bullish trend structure despite a -7 weak-bearish signal. RSI at 64.2 and BB %B at 89.0% show price is near the upper end of its recent range, while $2,567 is the key swing-high resistance and $2,404 is the nearest pivot support.
Key Levels
| Price | Type | Source | Significance | Distance |
|---|---|---|---|---|
| $2,928 | Resistance | Pivot R3 | Low | +15.5% |
| $2,797 | Resistance | Pivot R2 | Medium | +10.4% |
| $2,666 | Resistance | Pivot R1 | Medium | +5.2% |
| $2,567 | Resistance | Swing High | High | +1.3% |
| $2,534 | Current | — | — | — |
| $2,404 | Support | Pivot S1 | Medium | -5.1% |
| $2,274 | Support | Pivot S2 | Medium | -10.3% |
| $2,244 | Support | EMA50 | Medium | -11.5% |
| $2,195 | Support | EMA200 | High | -13.4% |
Moving Averages
| MA | Value | Position | Signal |
|---|---|---|---|
| EMA 20 | $2,419 | Above | Bullish |
| EMA 50 | $2,244 | Above | Bullish |
| EMA 200 | $2,195 | Above | Bullish |
| BB Middle (SMA 20) | $2,477 | Above | Bullish |
Volume Analysis
Volume is only 0.80x average as of September 12, 2026, so the move toward $2,567 lacks strong participation confirmation. The $98.05 ATR also implies roughly $98 of typical price movement, making a breakout above $2,567 more credible only if volume rises materially above the current 0.80x ratio.
Technical Indicators
Trade Setup
Scenario Analysis
Bullish Case
Trigger: Break and hold above $2,567 with volume rising above 1.00x average
Target: $2,665
Invalidation: $2,504
A sustained move above $2,567 would clear the current swing high while ETH remains above the $2,419 EMA20, supporting continuation toward $2,665. The $98.05 ATR makes a target near $2,665 technically consistent with one additional average-range move above resistance.
Base Case
Trigger: Price holds $2,404 while remaining below $2,567
Target: $2,404-$2,567
Invalidation: Daily close below $2,404
The base case is consolidation because $2,534 sits between the $2,404 support and $2,567 resistance while volume remains only 0.80x average. Funding at 0.0024% and a 1.21 long/short ratio show a modest long bias, but neither confirms a directional breakout as of September 12, 2026.
Bearish Case
Trigger: Break and close below $2,404
Target: $2,306
Invalidation: Recovery above $2,467
A break below $2,404 would weaken the current structure and expose a move toward $2,306, roughly one $98.05 ATR below the pivot. The bearish setup would gain confirmation if RSI falls from 64.2 while volume expands beyond the current 0.80x average.
Analysis Summary
Ethereum (ETH) Resources