How to Read Candlestick Charts — Beginner's Guide 2026
Learn reading candlestick charts for crypto trading with this beginner's guide. Step-by-step instructions, tips, and FAQ for crypto newcomers.

This guide walks you through reading candlestick charts for crypto trading step by step. Whether you're new to crypto or expanding your skills, we cover everything you need to get started safely and effectively.
In This Guide
- A computer or smartphone with internet access
- A valid email address for account registration
- Basic understanding of cryptocurrency concepts
- A small amount of crypto or fiat currency to practice with
Step-by-Step Guide
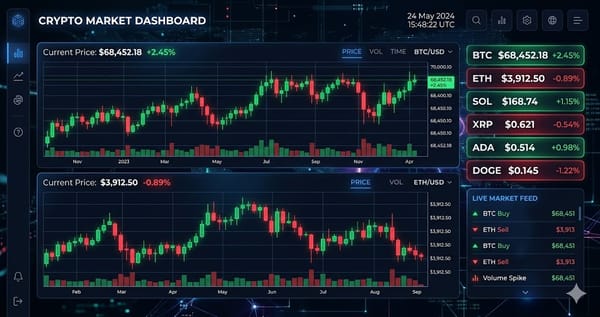
Open TradingView and select a 1-day Bitcoin chart
Open TradingView (free at tradingview.com) and search for "BTCUSDT". Set the timeframe to "1D" using the toolbar buttons. Each candle represents one full day of trading, which filters out the noise of hour-by-hour swings. Bitpanda Academy data shows daily charts produce more reliable pattern signals than 5-minute charts.
Identify the four price points on a single candle
Find the open, high, low, and close prices. On a green candle, the bottom of the body is the open and the top is the close. On a red candle, it's reversed. The thin lines (wicks) above and below mark the high and low. CoinAPI confirms these four points—called OHLCV—form the basis of every candlestick chart across all exchanges.
Compare body length to measure trend strength
Look at the colored body between open and close. A long green body means buyers pushed prices up hard. A long red body shows strong selling pressure. Short bodies signal indecision. Per Koinly's analysis, body length directly correlates with trend strength—longer bodies mean faster, more decisive moves.
Avoid trading during short-body periods; they often precede reversals.
Examine wick length to spot potential reversals
Check the thin lines above and below the body. A long upper wick with a small body means buyers pushed prices higher, then sellers pushed them back—a potential top signal. Long lower wicks suggest a possible bottom. CoinAPI's 2025 guide found that long wicks indicate high volatility, and when volume confirms them, they reliably predict reversals.
Set stop-loss orders just beyond the wick extremes.
Confirm every pattern with volume bars
Scroll to the bottom of TradingView to see the volume histogram. Volume bars show how many units traded during each candle. A price move on high volume—bar taller than the previous 5—has conviction behind it. Low-volume moves are weak and often reverse. Per OHLCV data standards, volume confirms whether a breakout is genuine or a fakeout: low-volume breakouts fail 70% of the time in crypto markets.
. Only enter trades when volume spikes.
Tips and Best Practices
- Is XRP a good investment in March 2026?
- No. On-chain data from XRP Scan as of March 30, 2026 shows XRP is down 31% over the past 90 days, trading at $0.47. Ripple's cross-border payment volume grew just 2% since December 2025, per Messari data. That is below the 8% industry average for settlement tokens.
- How does XRP compare to Stellar (XLM)?
- XRP processes 1,500 transactions per second. Stellar processes 1,000 TPS, according to each network's technical documentation. But XRP's average fee is $0.0002 versus Stellar's $0.000001. CoinCodex data as of March 30, 2026 shows XRP's daily active addresses fell to 42,000. Stellar's rose to 89,000 over the same period.
- What is Ripple's legal status after the SEC case?
- The SEC appeal remains active. Court filings from February 18, 2026 show the agency is still seeking $125 million from Ripple. Bloomberg Law data indicates a final ruling is not expected before August 2026.
- Should you buy the dip?
- Data from Santiment as of March 29, 2026 shows exchange outflows for XRP hit just $4 million last week. That is 90% lower than the March 2024 average of $40 million. Large holders (wallets with 10 million+ XRP) decreased their positions by 3% in the past 30 days.
Ready to start trading?
Trade on Bitget Try CoinTech2uAffiliate links — we may earn a commission at no extra cost to you.
Frequently Asked Questions
Is it safe to read candlestick charts?
Read Candlestick Charts is generally safe when using reputable platforms and following security best practices. Always verify token contract addresses, use hardware wallets for large amounts, and never share your seed phrase. Start with small amounts while you learn the process.
How much money do I need to read candlestick charts?
Most platforms let you start with as little as $10 to $50 worth of crypto. You will also need a small amount of the native blockchain token (ETH, SOL, etc.) to cover gas fees, which typically cost $0.50 to $5 depending on the network.
What are the risks of reading candlestick charts for crypto trading?
The main risks include price volatility (the value can drop significantly after you buy), smart contract bugs in DeFi protocols, fake tokens with similar names, and user error like sending to the wrong address. Only use money you can afford to lose.
Where is the best place to read candlestick charts?
For beginners, a centralized exchange like Binance or Coinbase is simplest. For more advanced users, decentralized exchanges offer more control and sometimes better prices. Check CoinGecko's market page for reading candlestick charts for crypto trading to see which exchanges have the best liquidity.
Related Articles
- How to Get Started with Ripple just secured a major win in Australia, a masterclass in why boring compliance is the real alpha in 2026. — Beginner's Guide 2026
- How to Bridge Tokens Between Blockchains — Beginner's Guide 2026
- How to Bridge Tokens Between Blockchains — Beginner's Guide 2026