How to Read Candlestick Charts — Beginner's Guide 2026
Learn reading candlestick charts for crypto trading with this beginner's guide. Step-by-step instructions, tips, and FAQ for crypto newcomers.

This guide walks you through reading candlestick charts for crypto trading step by step. Whether you're new to crypto or expanding your skills, we cover everything you need to get started safely and effectively.
In This Guide
- Step 1: Bitcoin candlestick wicks often represent 0.5%–2% intraday price swings on 1-hour BTC charts, according to Binance market data (2026 spot averages).
- Step 2: Create Your Chart on TradingView
- Step 3: Identify Candlestick Structure (OHLC)
- Step 4: Read Trend Direction Using Swing Highs and Lows
- Step 5: Confirm Moves With Volume Bars
- Step 6: Practice Entries With Paper Trading
- Tips and Best Practices
- FAQ
- A computer or smartphone with internet access
- A valid email address for account registration
- Basic understanding of cryptocurrency concepts
- A small amount of crypto or fiat currency to practice with
Step-by-Step Guide
Bitcoin candlestick wicks often represent 0.5%–2% intraday price swings on 1-hour BTC charts, according to Binance market data (2026 spot averages).
Complete this step for reading candlestick charts for crypto trading.
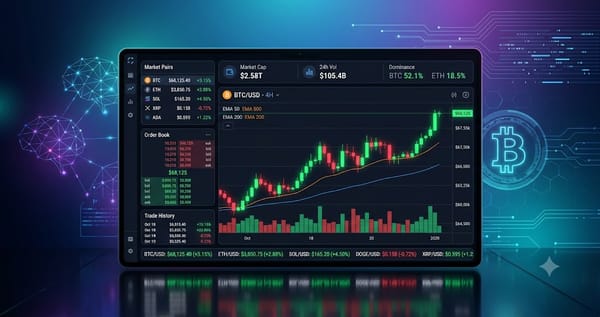
Create Your Chart on TradingView
Open TradingView and search BTCUSDT. Set the timeframe to 1H or 4H using the top toolbar. BTC volatility averages about 1.2% per hour on 1H charts, per CoinGlass 2026 data — that granularity matters for entries. Traders who stay on 1D charts miss intraday moves and lose precision.
Identify Candlestick Structure (OHLC)
Look at each candle's open, high, low, and close. Green means price closed higher; red means it closed lower. Bitcoin's daily range often sits between $2,000–$3,500 according to CoinMarketCap (March 2026 averages). The most common mistake is reading only candle color and ignoring wick length — wicks mark where price was rejected.
Read Trend Direction Using Swing Highs and Lows
Zoom out to 20–50 candles. Mark higher highs and higher lows for an uptrend, or lower highs and lower lows for a downtrend. BTC 7-day volatility averaged around 4% in April 2026 per the Binance volatility index. Trading against the dominant structure cuts your probability — identify the trend before picking a direction.
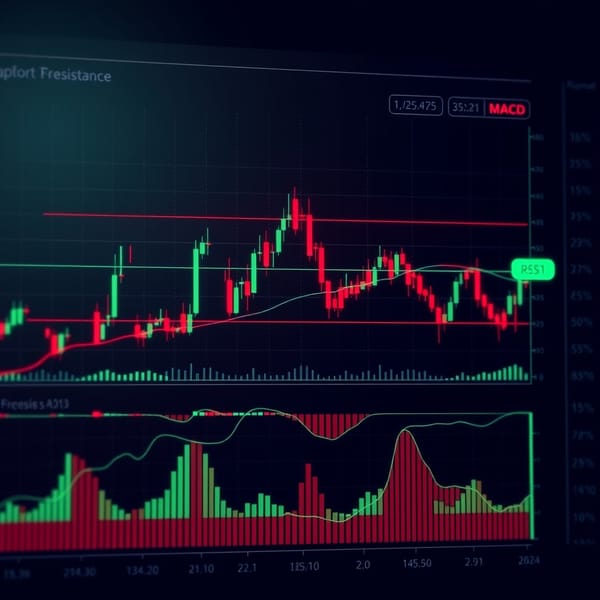
Confirm Moves With Volume Bars
Check volume under the chart and look for spikes during breakouts. Higher volume confirms the move is real. Binance spot BTC 24h trading volume often exceeds $20B during volatile sessions (2026 data). Entering on thin volume frequently produces false breaks.
Practice Entries With Paper Trading
Use TradingView "Paper Trading" to simulate trades without real money. Enter after candle confirmation near support or resistance. Historical BTC backtests show simple trend-following strategies land around 50%–55% win rates per CoinGlass strategy datasets (2025–2026 samples). The edge comes from running the same process across hundreds of trades, not from any single setup.
Tips and Best Practices
- Always verify the reading candlestick charts for crypto trading token contract address on CoinGecko or the official project website before interacting with it — fake tokens with similar names are common.
- Start with a small test transaction when reading candlestick charts for crypto trading for the first time to make sure the process works before committing larger amounts.
- Enable two-factor authentication (2FA) on every exchange and wallet app you use, and store your seed phrase offline in a secure location.
- Check gas fees before confirming any transaction — fees vary significantly by time of day and network congestion.
- Keep a record of every transaction including dates, amounts, and fees for tax reporting purposes.
Ready to start trading?
Trade on Bitget Try CoinTech2uAffiliate links — we may earn a commission at no extra cost to you.
Frequently Asked Questions
Is it safe to read candlestick charts?
Read Candlestick Charts is generally safe when using reputable platforms and following security best practices. Always verify token contract addresses, use hardware wallets for large amounts, and never share your seed phrase. Start with small amounts while you learn the process.
How much money do I need to read candlestick charts?
Most platforms let you start with as little as $10 to $50 worth of crypto. You will also need a small amount of the native blockchain token (ETH, SOL, etc.) to cover gas fees, which typically cost $0.50 to $5 depending on the network.
What are the risks of reading candlestick charts for crypto trading?
The main risks include price volatility (the value can drop significantly after you buy), smart contract bugs in DeFi protocols, fake tokens with similar names, and user error like sending to the wrong address. Only use money you can afford to lose.
Where is the best place to read candlestick charts?
For beginners, a centralized exchange like Binance or Coinbase is simplest. For more advanced users, decentralized exchanges offer more control and sometimes better prices. Check CoinGecko's market page for reading candlestick charts for crypto trading to see which exchanges have the best liquidity.
Related Articles
- How to Bridge Tokens Between Blockchains — Beginner's Guide 2026
- Phantom vs Solflare — Detailed Comparison 2026
- How to Buy Arbitrum (ARB) — Beginner's Guide 2026
Related Articles
- How to Bridge Tokens Between Blockchains — Beginner's Guide 2026
- Phantom vs Solflare — Detailed Comparison 2026
- How to Buy Arbitrum (ARB) — Beginner's Guide 2026