How to Use On-Chain Data to Trade Crypto in 2026
Learn how to trade crypto using on-chain data, whale tracking, and key metrics like SOPR, MVRV, and token velocity in 2026.

On-chain data has become one of the most reliable ways to understand crypto market behavior in
In This Guide
Step-by-Step Guide
Identify the Market Phase Using Bitcoin
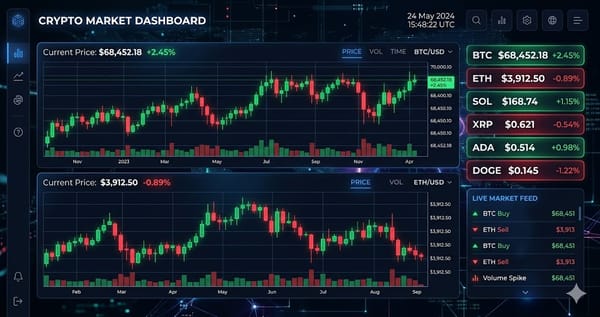
Start by analyzing Bitcoin because it sets the direction for the broader crypto market. Key metrics include MVRV Z-Score, SOPR, and exchange reserves, which together indicate whether the market is in accumulation, expansion, or distribution.
As of 2026, values like a low MVRV Z-Score (around 1.2) and SOPR below 1.0 suggest a phase where coins are being sold at a loss. Meanwhile, declining exchange reserves indicate supply is leaving exchanges, often a precursor to upward price movement.
Track Supply Distribution and Whale Activity
Focus on large wallet movements to understand where smart money is positioned. Whale accumulation often precedes major price shifts, especially when combined with decreasing exchange supply.
Monitor wallets holding large amounts of BTC or ETH and track their inflows and outflows. Increasing whale wallets or large-scale withdrawals from exchanges typically signal accumulation, while deposits to exchanges can indicate potential selling pressure.
Analyze Token Velocity and Network Usage
Token velocity measures how actively a token is being used compared to its market cap. High velocity suggests strong usage, while low velocity indicates holding or reduced activity.
Stablecoin velocity is especially important because it reflects real capital movement across DeFi and trading platforms. Rising velocity often signals increased market participation, while declining velocity can indicate capital sitting idle.
Evaluate Altcoins Using On-Chain Metrics
Move beyond Bitcoin and apply metrics like NVT, MVRV, and active addresses to altcoins such as Ethereum and Solana. These metrics help determine whether a token is undervalued or overextended.
For example, strong whale accumulation in ETH combined with high network activity and stable support levels can signal a potential breakout. Compare multiple tokens to identify where capital is rotating.
Combine On-Chain Data with Price Structure
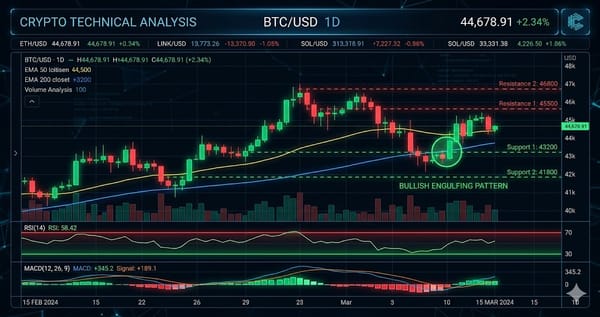
Use on-chain signals alongside technical levels to confirm trade setups. Support, resistance, and liquidity zones must align with accumulation or distribution patterns.
When metrics like SOPR, funding rates, and whale accumulation align with price compression near support, it often precedes a move. Conversely, rising prices with declining on-chain strength can signal a weakening trend.
Tips and Best Practices
- Always test with small amounts before committing significant funds.
- Bookmark the official websites of tools mentioned in this guide to avoid phishing.
- Keep detailed records of your transactions for tax reporting purposes.
Ready to start trading?
Trade on Bitget Try CoinTech2uAffiliate links — we may earn a commission at no extra cost to you.
Related Articles
- AI Predictions for ETH vs BTC in 2026: Live Tracking, Accuracy Limits, and Execution Framework
- How to Turn Crypto Headlines into Viral Shorts Using AI (2026 Step-by-Step Guide)
- The Crypto Complexity Crisis: A 2026 Guide to Onboarding Without the Headache