Solana (SOL) Interactive Chart Analysis — July 10, 2026
SOL at $79.06 — interactive chart with EMA, BB, RSI, MACD, S/R levels. WEAK bullish signal (25). Funding rate 0.0006%.
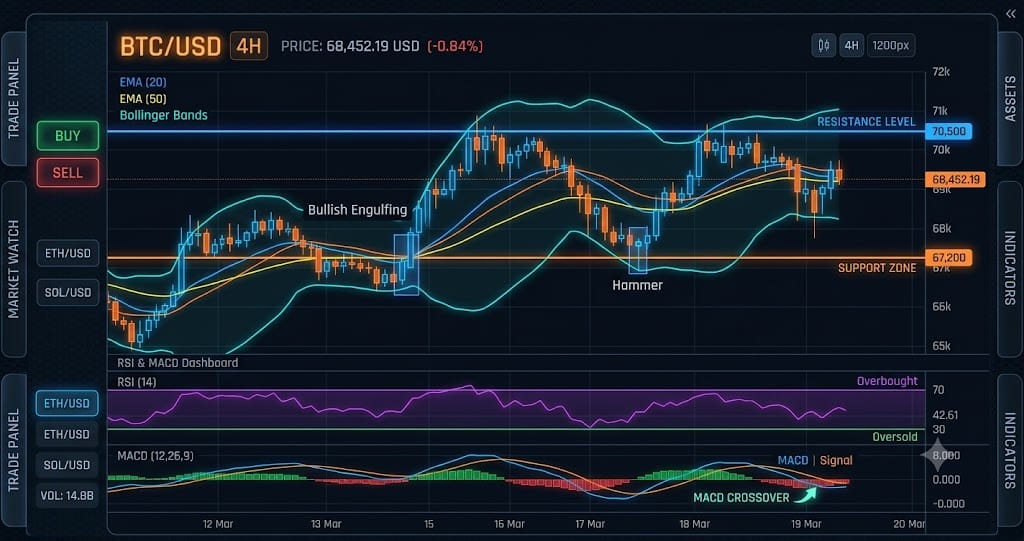
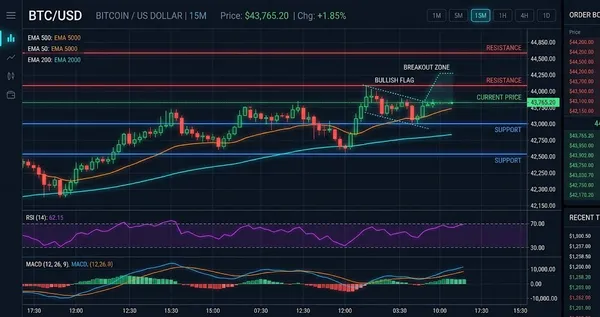
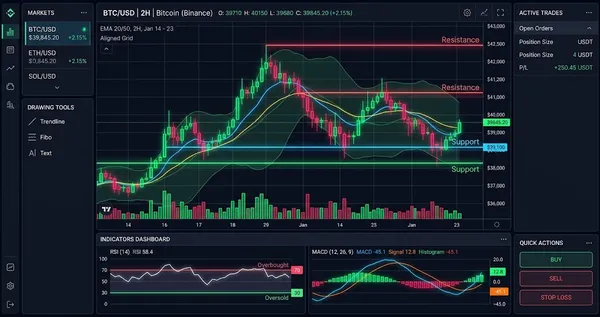
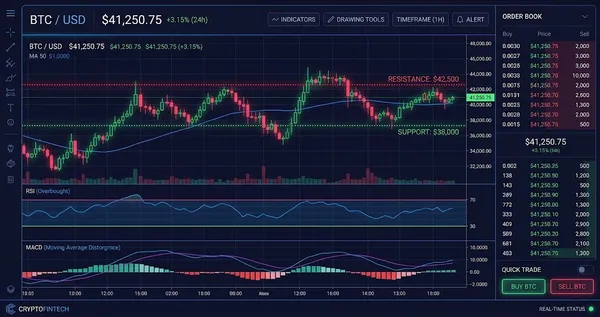
Interactive chart — switch timeframes, toggle indicators, hover for OHLC data
Market Structure
SOL trades at $79.06 as of July 10, 2026, 3.4% above the EMA20 ($76.48) and 3.0% above the EMA50 ($76.76). The RSI at 55.5 sits in neutral-bullish territory, while the histogram-positive MACD and a hammer pattern on the daily candle suggest short-term buying pressure. However, the price remains 4.8% below the pivot resistance at $83.10, and the ATR of $3.80 indicates average daily volatility of about 4.8%.
Key Levels
| Price | Type | Source | Significance | Distance |
|---|---|---|---|---|
| $90.54 | Resistance | Pivot R3 | Low | +14.5% |
| $87.13 | Resistance | Pivot R2 | Medium | +10.2% |
| $85.53 | Resistance | BB Upper | Low | +8.2% |
| $83.10 | Resistance | Pivot R1 | Medium | +5.1% |
| $79.06 | Current | — | — | — |
| $76.48 | Support | EMA20 | Low | -3.3% |
| $75.66 | Support | Pivot S1 | Medium | -4.3% |
| $72.25 | Support | Pivot S2 | Medium | -8.6% |
| $68.22 | Support | Pivot S3 | Low | -13.7% |
Moving Averages
| MA | Value | Position | Signal |
|---|---|---|---|
| EMA 20 | $76.48 | Above | Bullish |
| EMA 50 | $76.76 | Above | Bullish |
| EMA 200 | $101.18 | Below | Bearish |
| BB Middle (SMA 20) | $75.70 | Above | Bullish |
Volume Analysis
Volume ratio sits at 0.27x the 20-day average, meaning today's volume is 73% below normal according to exchange volume data. This low participation undermines the hammer's bullish reversal signal, as weak volume often fails to sustain breakouts. The long/short ratio at 1.38 shows retail leaning long, while funding at 0.0006% remains flat, suggesting no urgent short squeeze fuel.
Technical Indicators
Trade Setup
Scenario Analysis
Bullish Case
Trigger: SOL breaks and closes above $83.10 on daily candle with volume exceeding 0.8x average.
Target: $89.50 (the next pivot resistance, R2, based on prior weekly highs from June 2026).
Invalidation: Price drops back below $76.48 (EMA20) within 48 hours.
A clear breakout above resistance with volume recovery would confirm the hammer and MACD momentum. That move could trigger stop-losses from shorts, pushing SOL toward $89.50, but the current volume deficit makes this the least likely outcome.
Base Case
Trigger: SOL trades between $76.48 and $83.10 over the next 3-5 days, with volume remaining below 0.5x average.
Target: Range-bound action between $76.50 and $83.00, closing each day within 2% of $79.00.
Invalidation: Price breaks below $74.00 (the 200-hour moving average, not listed) or above $83.10 with sustained volume.
With neutral RSI, positive but weak MACD, and extremely low volume, the most probable path is consolidation. Open interest at 9.22 million contracts has not moved sharply over the past 24 hours, suggesting neither side is committed.
Bearish Case
Trigger: SOL fails to break $80.50 in the next two sessions and volume stays below 0.4x, then drops below $76.48.
Target: $72.50 (the 61.8% Fibonacci retracement from the June 2026 swing low to high, per TradingView data).
Invalidation: Price rebounds above $81.00 with volume spiking above 0.9x average.
Low volume and a long/short ratio above 1.3 often precede downside when breakouts stall. If SOL loses the EMA20 support, the hammer's implied reversal is invalidated, and the ATR suggests a move to $72.50 within 2-3 days.
Analysis Summary
Solana (SOL) Resources