
Solana (SOL) Interactive Chart Analysis — August 27, 2026
SOL at $104.98 — interactive chart with EMA, BB, RSI, MACD, S/R levels. CONFLICTED neutral signal (10). Funding rate 0.0100%.
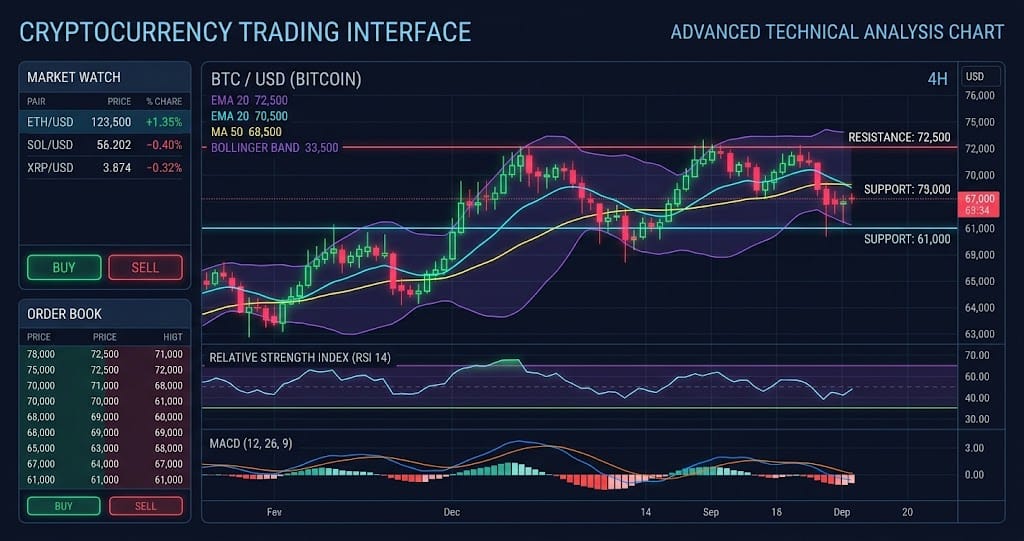
Interactive chart — switch timeframes, toggle indicators, hover for OHLC data
Market Structure
$104.98 puts SOL in a strong short-term uptrend, with price $17.93 above EMA20 at $87.05 and $23.63 above EMA50 at $81.35, according to the provided August 27, 2026 indicator data. However, RSI at 84.9 and BB %B at 103.2% show extreme momentum, while resistance at $109.51 leaves only $4.53 of upside before the first major pivot.
Key Levels
| Price | Type | Source | Significance | Distance |
|---|---|---|---|---|
| $123.02 | Resistance | Pivot R3 | Low | +17.2% |
| $114.04 | Resistance | Pivot R2 | Medium | +8.6% |
| $109.51 | Resistance | Pivot R1 | Medium | +4.3% |
| $104.98 | Current | — | — | — |
| $103.71 | Support | BB Upper | Low | -1.2% |
| $96.00 | Support | Pivot S1 | Medium | -8.6% |
| $89.46 | Support | EMA200 | High | -14.8% |
| $87.02 | Support | Pivot S2 | Medium | -17.1% |
Moving Averages
| MA | Value | Position | Signal |
|---|---|---|---|
| EMA 20 | $87.05 | Above | Bullish |
| EMA 50 | $81.35 | Above | Bullish |
| EMA 200 | $89.46 | Above | Bullish |
| BB Middle (SMA 20) | $84.04 | Above | Bullish |
Volume Analysis
1.45x average volume confirms that the move has meaningful participation rather than occurring on thin activity, based on the provided August 27, 2026 volume ratio. Funding at 0.0100% and a 2.07 long/short ratio show a strong long bias, so sustained volume above 1.45x would support continuation while fading volume would increase pullback risk.
Technical Indicators
Trade Setup
Scenario Analysis
Bullish Case
Trigger: Sustained move above $109.51 with volume remaining above 1.45x average
Target: $118.65
Invalidation: $103.71
A break above $109.51 would clear Pivot R1 while RSI at 84.9 shows that momentum remains exceptionally strong. The bullish case targets $118.65, but SOL must hold $103.71 after the breakout to preserve the structure.
Base Case
Trigger: Price holds $103.71 while failing to sustain a break above $109.51
Target: $103.71-$109.51
Invalidation: Sustained close below $103.71
The most likely scenario is consolidation between $103.71 and $109.51 because RSI at 84.9 is overbought while volume is still 1.45x average. SOL could digest the rally without reversing the trend as long as $103.71 remains intact.
Bearish Case
Trigger: Breakdown below $103.71 accompanied by weakening volume or renewed selling pressure
Target: $94.57
Invalidation: Sustained move above $109.51
A break below $103.71 would signal that the extreme RSI reading of 84.9 is translating into a momentum reset rather than immediate continuation. With ATR at $4.57, a move toward $94.57 would represent a realistic downside extension while the broader EMA structure remains bullish.
Analysis Summary
Solana (SOL) Resources