
Solana (SOL) Interactive Chart Analysis — August 30, 2026
SOL at $104.84 — interactive chart with EMA, BB, RSI, MACD, S/R levels. CONFLICTED neutral signal (10). Funding rate -0.0011%.
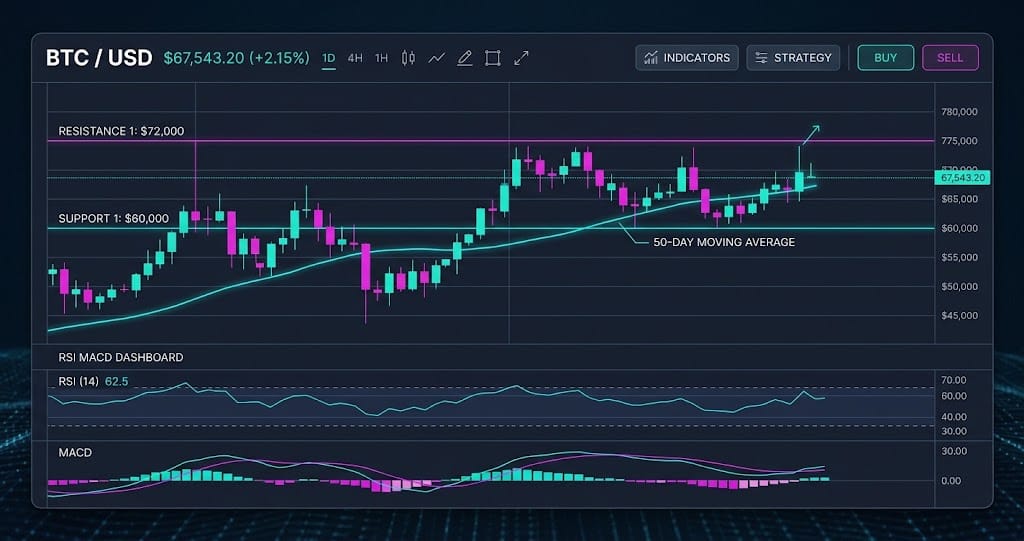
Interactive chart — switch timeframes, toggle indicators, hover for OHLC data
Market Structure
Price at $104.84 trades 14.4% above the EMA20 ($91.60) and 24.6% above the EMA50 ($84.11), based on the provided indicator set. RSI at 79.7 is deep into overbought territory, while the positive MACD histogram confirms residual upside momentum. ATR of $4.59 sets a daily average range of roughly $9.18, making the pivot support at $96.32 and resistance at $111.98 the critical boundaries for the next move.
Key Levels
| Price | Type | Source | Significance | Distance |
|---|---|---|---|---|
| $127.64 | Resistance | Pivot R3 | Low | +21.8% |
| $119.13 | Resistance | Pivot R2 | Medium | +13.6% |
| $111.98 | Resistance | Pivot R1 | Medium | +6.8% |
| $104.84 | Current | — | — | — |
| $96.32 | Support | Pivot S1 | Medium | -8.1% |
| $91.60 | Support | EMA20 | Low | -12.6% |
| $89.68 | Support | EMA200 | High | -14.5% |
| $87.81 | Support | Pivot S2 | Medium | -16.2% |
Moving Averages
| MA | Value | Position | Signal |
|---|---|---|---|
| EMA 20 | $91.60 | Above | Bullish |
| EMA 50 | $84.11 | Above | Bullish |
| EMA 200 | $89.68 | Above | Bullish |
| BB Middle (SMA 20) | $88.42 | Above | Bullish |
Volume Analysis
Volume ratio at 0.41x average shows current trading activity is less than half of typical levels, per the volume metric. This low participation undermines the bullish price action above $100 and increases the risk of a false breakout. Price moves on thin volume often reverse sharply, especially when RSI exceeds 70.
Technical Indicators
Trade Setup
Scenario Analysis
Bullish Case
Trigger: Daily close above $111.98 (Pivot R1) with volume ratio recovering to 0.80x or higher.
Target: $124.50
Invalidation: Daily close back below $104.84 or RSI falling under 70.
A confirmed breakout above resistance with rising volume could force short covering despite the 2.10 long/short ratio. However, the overbought RSI and historically low volume make this the lowest-probability outcome as of the current data snapshot.
Base Case
Trigger: Price holds between $96.32 and $111.98 over the next 3 sessions, with volume ratio staying below 0.60x.
Target: $100 - $108 range
Invalidation: Daily close above $111.98 or below $96.32.
The neutral signal reading of 10 and conflicting indicators (overbought RSI vs positive MACD) point to range-bound consolidation. Funding at -0.0011% and Open Interest of 8.56 million contracts suggest moderate bearish hedging, which may stabilize price near the midpoint.
Bearish Case
Trigger: Daily close below $96.32 support accompanied by volume ratio increasing above 0.80x.
Target: $84.11 (EMA50)
Invalidation: Price reclaims $104.84 within the next 24 hours.
RSI at 79.7 combined with 0.41x average volume indicates a weak rally susceptible to a rapid downside flush. The 2.10 long/short ratio implies overcrowded longs; a break below support could trigger liquidations that accelerate the move toward the EMA50 at $84.11.
Analysis Summary
Solana (SOL) Resources