
Solana (SOL) Interactive Chart Analysis — September 3, 2026
SOL at $100.54 — interactive chart with EMA, BB, RSI, MACD, S/R levels. CONFLICTED neutral signal (-2). Funding rate 0.0046%.
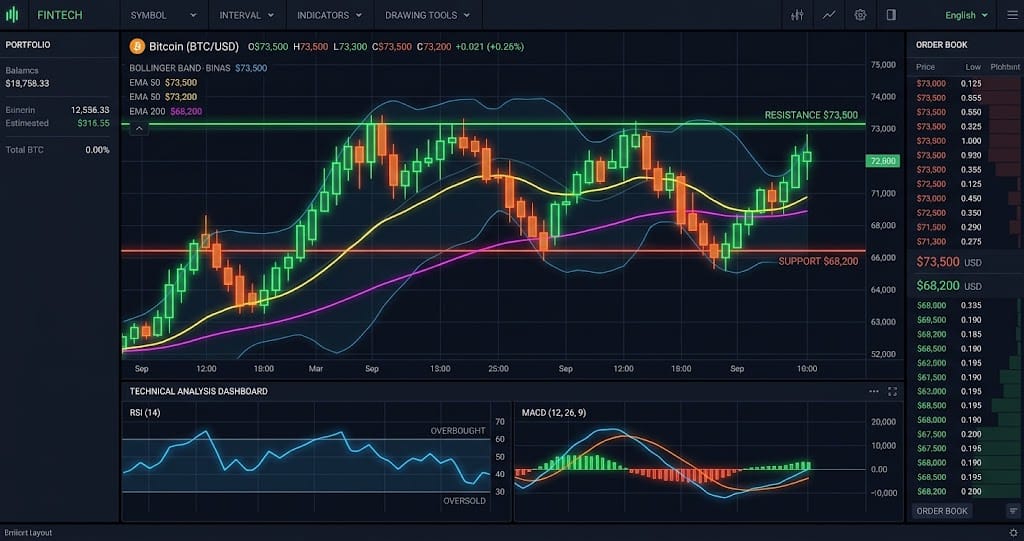
Interactive chart — switch timeframes, toggle indicators, hover for OHLC data
Market Structure
SOL trades at $100.54, holding 6.8% above the EMA20 ($94.12) and 16.0% above the EMA50 ($86.67). The MACD histogram turned negative and the RSI sits at 65.3, creating a conflict between trend strength and short-term momentum. The hammer pattern on the daily candle suggests a potential rejection of lower prices, but it requires follow-through above $106.21 to confirm.
Key Levels
| Price | Type | Source | Significance | Distance |
|---|---|---|---|---|
| $116.29 | Resistance | Pivot R3 | Low | +15.7% |
| $115.08 | Resistance | BB Upper | Low | +14.5% |
| $111.88 | Resistance | Pivot R2 | Medium | +11.3% |
| $106.21 | Resistance | Pivot R1 | Medium | +5.6% |
| $100.54 | Current | — | — | — |
| $96.13 | Support | Pivot S1 | Medium | -4.4% |
| $94.12 | Support | EMA20 | Low | -6.4% |
| $91.72 | Support | Pivot S2 | Medium | -8.8% |
| $89.94 | Support | EMA200 | High | -10.5% |
Moving Averages
| MA | Value | Position | Signal |
|---|---|---|---|
| EMA 20 | $94.12 | Above | Bullish |
| EMA 50 | $86.67 | Above | Bullish |
| EMA 200 | $89.94 | Above | Bullish |
| BB Middle (SMA 20) | $93.63 | Above | Bullish |
Volume Analysis
Volume sits at 0.81x the 30-day average, indicating below-average participation in the current price move per the provided volume ratio. Low volume weakens the hammer's reversal signal and makes a breakout above R1 less credible without a surge in activity. On-chain data shows open interest at 8.63 million contracts, with a long/short ratio of 2.05, meaning leveraged longs outnumber shorts by more than 2-to-1.
Technical Indicators
Trade Setup
Scenario Analysis
Bullish Case
Trigger: Daily close above $106.21 (Pivot R1) with volume ratio exceeding 1.2x.
Target: $114.80 (next Fibonacci extension from the $96.13 low).
Invalidation: Price breaks below $96.13 on high volume (ATR > $4.66).
A confirmed break above R1 would resolve the MACD bearish divergence, as momentum typically follows price through resistance. The 0.0046% funding rate remains low enough that a long squeeze is not imminent, allowing fresh buyers to push toward the $115 zone.
Base Case
Trigger: Price oscillates between $96.13 support and $106.21 resistance over the next 48 hours.
Target: Range-bound trading within $97.50 to $104.00, with a weekly close near $101.00.
Invalidation: A sustained move below $96.13 or above $106.21 on 1.0x+ average volume.
The RSI at 65.3 and negative MACD histogram suggest equilibrium, while the 0.81x volume ratio confirms a lack of directional conviction. With open interest high and longs heavily skewed (2.05 ratio), any move is likely capped until leverage flushes or a catalyst arrives.
Bearish Case
Trigger: Price breaks below $96.13 (Pivot S1) with an hourly close, accompanied by volume expanding above 1.0x average.
Target: $89.40 (midpoint between EMA50 at $86.67 and current price).
Invalidation: Price reclaims $100.54 within 4 hours of the breakdown.
The bearish MACD crossover and negative histogram already signal waning upward momentum, and a support break would trigger long liquidations given the 2.05 long/short ratio. Per the ATR of $4.66, a move to $89.40 represents a 1.2x ATR decline, a realistic extension if stops cascade below S1.
Analysis Summary
Solana (SOL) Resources