
Solana (SOL) Interactive Chart Analysis — September 5, 2026
SOL at $102.72 — interactive chart with EMA, BB, RSI, MACD, S/R levels. WEAK bearish signal (-2). Funding rate 0.0018%.
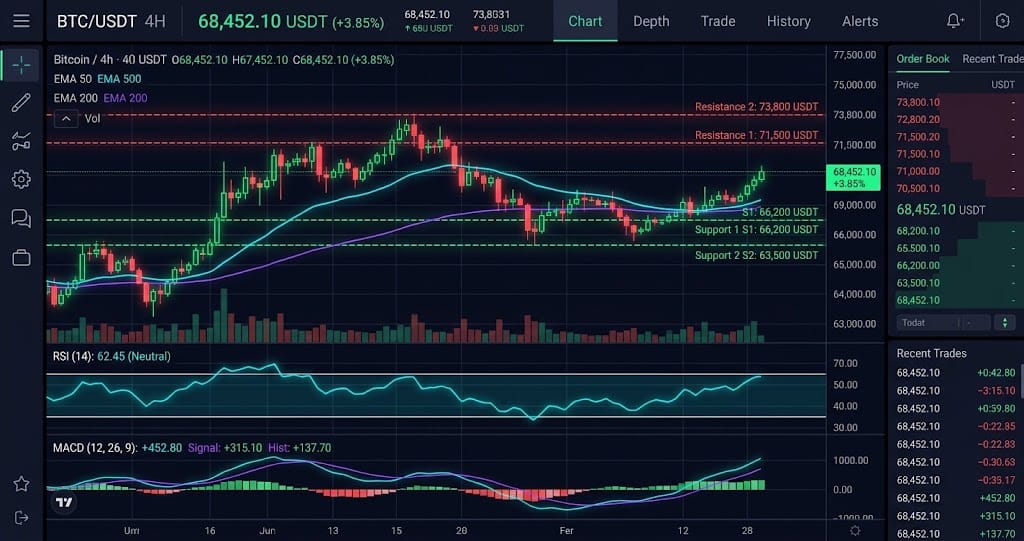
Interactive chart — switch timeframes, toggle indicators, hover for OHLC data
Market Structure
SOL trades at $102.72 with a -2 WEAK bearish signal, but the price remains above the EMA20 at $95.67 and EMA50 at $88.03. RSI is 64.0 and BB %B is 66.8%, showing positive positioning as of September 5, 2026, while the negative MACD histogram limits bullish momentum.
Key Levels
| Price | Type | Source | Significance | Distance |
|---|---|---|---|---|
| $115.21 | Resistance | Pivot R3 | Low | +12.2% |
| $110.58 | Resistance | Pivot R2 | Medium | +7.7% |
| $106.65 | Resistance | Pivot R1 | Medium | +3.8% |
| $102.72 | Current | — | — | — |
| $98.09 | Support | Pivot S1 | Medium | -4.5% |
| $95.67 | Support | EMA20 | Low | -6.9% |
| $93.46 | Support | Pivot S2 | Medium | -9.0% |
| $89.53 | Support | Pivot S3 | Low | -12.8% |
Moving Averages
| MA | Value | Position | Signal |
|---|---|---|---|
| EMA 20 | $95.67 | Above | Bullish |
| EMA 50 | $88.03 | Above | Bullish |
| EMA 200 | $90.12 | Above | Bullish |
| BB Middle (SMA 20) | $96.52 | Above | Bullish |
Volume Analysis
Volume is only 0.27x average, according to the provided indicator data, so the move toward $106.65 resistance lacks strong participation. Open interest stands at 8,241,375 contracts and the long/short ratio is 2.37, creating crowded long positioning that could amplify a reversal.
Technical Indicators
Trade Setup
Scenario Analysis
Bullish Case
Trigger: A sustained break above $106.65 with volume rising materially above the current 0.27x average.
Target: $111.45
Invalidation: A close below $98.09
SOL remains above its $95.67 EMA20 and $88.03 EMA50, supporting a bullish continuation if $106.65 breaks. With RSI at 64.0, momentum has room to rise before reaching typical overbought territory, but volume must confirm the breakout.
Base Case
Trigger: Price remains between $98.09 support and $106.65 resistance while volume stays below average.
Target: $98.09-$106.65
Invalidation: A decisive close outside the $98.09-$106.65 range with expanding volume
The highest-probability case is consolidation because SOL sits between defined pivot levels with volume at only 0.27x average. ATR of $4.80 supports meaningful daily movement, but the weak bearish signal and negative MACD histogram may keep rallies capped below $106.65.
Bearish Case
Trigger: A break below $98.09, especially if the negative MACD histogram expands.
Target: $93.29
Invalidation: A sustained move above $106.65
A loss of $98.09 would weaken the current structure and expose a move roughly one ATR below support toward $93.29. The 2.37 long/short ratio increases downside risk because crowded long positions could unwind quickly after a support break.
Analysis Summary
Solana (SOL) Resources