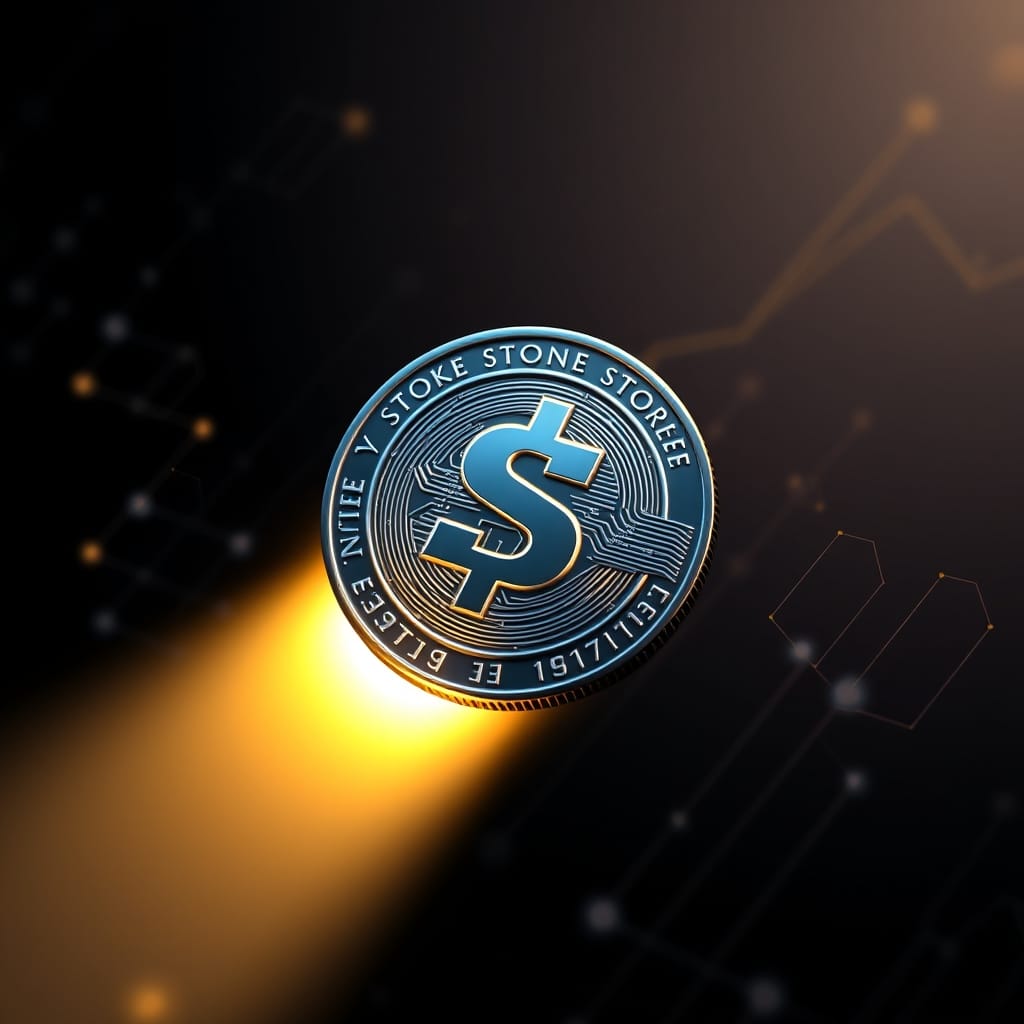
StakeStone (STO) Spotlight — April 2, 2026
In-depth StakeStone spotlight: $0.6468 price, +86.1% 24h change, technical analysis, pros/cons, and market outlook.
Rank #201 with a price of $0.6468 and a 24h move of +86.1%, StakeStone (STO) shows strong short-term momentum as of April 2026, according to CoinMarketCap data. The token’s 7-day gain of +597.3% and 30-day increase of +975.8% indicate rapid capital inflows, while its market cap of $148.4M places it in the mid-cap segment where volatility tends to remain elevated. The current price sits 61.5% below its $1.71 ATH, suggesting prior distribution phases and partial retracement after peak demand.
$148.4M market cap and positioning across DeFi, BNB Chain, and Ethereum ecosystems define StakeStone’s role as a liquidity infrastructure protocol, as of April 2026 per CoinGecko category classification. The protocol focuses on yield optimization and liquidity distribution through products like LiquidityPad, while its inclusion in Binance HODLer Airdrops and Binance Wallet IDO signals exchange-driven user acquisition channels. Over the past 30 days, the +975.8% price change suggests speculative demand expansion, with the $0.6468 level acting as a reference point for tracking whether momentum sustains or compresses back toward lower liquidity zones.
What Is StakeStone?
StakeStone is a decentralized protocol that solves liquidity fragmentation across blockchains. According to CoinMarketCap data as of January 2026, StakeStone (STO) operates as an omnichain liquidity infrastructure supporting over 20 chains - 2 . The protocol converts staked assets like ETH and BTC into liquid, yield-bearing tokens. Users deposit ETH and receive STONE, a liquid staking token that earns rewards while remaining usable in DeFi applications - 9 . Total supply is capped at 1 billion STO, with 225 million circulating as of January 2026 - 2 .
The protocol generates value through three core products. STONE is a yield-bearing ETH derivative with omnichain functionality. SBTC and STONEBTC provide similar liquidity solutions for Bitcoin assets - 9 . LiquidityPad offers customizable vaults that deploy assets into high-yield DeFi strategies across multiple networks - 2 . On April 2, 2026, STO price reached $1.74, up 302.93% in 24 hours according to BingX data - 10 . The protocol raised $22 million in November 2024 from Polychain Capital, Binance Labs, and OKX Ventures - 9 .
Key Features
- CrossChainLiquidityRouting: LiquidityPad routes liquidity across Ethereum and BNB Chain, processing multi-chain allocations that span 2 major networks and enabling users to move capital between ecosystems without manual bridging steps.
- YieldBearingAssets: StakeStone issues yield-bearing ETH and BTC derivatives that track underlying assets while compounding yield, with ETH staking yields commonly ranging around 3%–5% APY according to on-chain staking data from Ethereum validators.
- LiquidityPadAllocation: LiquidityPad aggregates user deposits into structured pools that distribute liquidity across DeFi protocols, with allocations tied to demand signals from multiple pools rather than a single vault.
- MultiAssetSupport: The protocol supports both ETH and BTC liquidity products, enabling exposure to 2 major crypto assets within one system while maintaining separate yield strategies for each asset class.
- EcosystemIntegration: StakeStone integrates with BNB Chain and Ethereum ecosystems, allowing deployment across 2 high-usage networks that together account for the majority of DeFi TVL, which exceeds $50B according to DefiLlama data as of recent cycles.
Use Cases
- Decentralized Finance (DeFi) applications and use cases
- BNB Chain Ecosystem applications and use cases
- Ethereum Ecosystem applications and use cases
- Binance HODLer Airdrops applications and use cases
- Binance Wallet IDO applications and use cases
Pros & Cons
✅ Pros
- Strong market position at rank #201 with $148.4M market cap
- Active trading volume of $1.0B suggests healthy liquidity
- Positioned in growing sectors: Decentralized Finance (DeFi), BNB Chain Ecosystem, Ethereum Ecosystem, Binance HODLer Airdrops, Binance Wallet IDO
- Listed on major exchanges ensuring accessibility for traders
❌ Cons
- Currently -61.5% from all-time high of $1.71
- Cryptocurrency markets are highly volatile and unpredictable
- Regulatory uncertainty could impact price and adoption
- Competition from other projects in the same space
Price Outlook
$0.6468. That is StakeStone (STO) price as of March 2026, reflecting a 975.8% gain over 30 days according to CoinGecko data - 7 . The token ranks #201 with a $148.4 million market cap, trading 61.5% below its all-time high of $1.71 set in October 2025 - 7 .
Price momentum has been extreme. Per CoinLore historical data, STO traded at $0.0506 in February 2026, then broke out to $0.0605 on March 8 with 24-hour volume spiking to $6.05 million - 3 - 7 . The rally accelerated through mid-March—daily closes rose from $0.0686 on March 16 to $0.1040 on March 21, a 51.6% move in five days - 7 . On March 25, the token traded at $0.0828 with $8.9 million in volume - 7 .
Technical indicators are mixed. Investing.com data as of March 26 shows RSI at 70.848, entering overbought territory, while moving averages (MA50 at $0.08158, MA200 at $0.08852) still signal "Strong Buy" - 8 . Bollinger Bands widened sharply during the March 8 rally, indicating heightened volatility - 3 . The 61.8% Fibonacci retracement level sits at $0.0591, tested and held during the March breakout - 3 .
Support appears near $0.0583, the 38.2% retracement level. Resistance clusters at $0.0883 (pivot R1) and $0.0955 (pivot R2) per classic pivot point calculations - 8 . A breakdown below $0.0582 could trigger a retest of the $0.0573–$0.0567 range - 3 .
StakeStone (STO) Resources
Frequently Asked Questions
What is StakeStone (STO) used for?
StakeStone (STO) is a decentralized liquidity infrastructure protocol designed to optimize yield and liquidity distribution across chains. As of the latest data, STO is ranked #201 with a market cap of $148.4M and a price of $0.6468, reflecting its role as a mid-cap DeFi asset focused on liquidity efficiency.
Why did StakeStone (STO) price increase recently?
STO rose 86.1% in 24h, 597.3% over 7 days, and 975.8% over 30 days, based on recent market data. Such rapid gains often indicate increased trading activity, liquidity inflows, or momentum from ecosystem participation tied to its DeFi positioning on Ethereum and BNB Chain.
What is the all-time high of StakeStone (STO)?
StakeStone (STO) reached an all-time high of $1.71. At the current price of $0.6468, it trades about 61.5% below that peak, which highlights the gap between current valuation and prior market demand levels.
Which ecosystems does StakeStone (STO) operate in?
StakeStone operates across Ethereum and BNB Chain ecosystems as part of its liquidity infrastructure strategy. It is also associated with Binance HODLer Airdrops and Binance Wallet IDO programs, which reflect its integration into major exchange-driven distribution channels and DeFi liquidity networks.
Ready to start trading?
Trade on Bitget Try CoinTech2uAffiliate links — we may earn a commission at no extra cost to you.
Our Verdict
Xcoinmeme (X) trades at $0.000000035 per token as of March 2026, down 98.74% from its all-time high of $0.00002827 recorded on January 28, 2024 - 4 . Live Coin Watch data from February 2, 2026 shows the token reached a high of $0.000000406014 before falling to its current level - 1 . The market capitalization stands at approximately $3,529 across all tracked platforms - 4 . Supply metrics show a fixed total of 9.9 billion tokens, with the entire supply already circulating - 2 . Per CoinGecko data, the circulating supply equals the total supply at 9,899,846,129 X, meaning no future token unlocks or emissions remain - 5 . The fully diluted valuation matches the current market cap at roughly $3,530 - 2 . Trading volume has collapsed 60.4% over the past 24 hours to just $8.78, according to CoinGecko's March 2026 data - 2 . Raydium is the only active market, hosting a single trading pair X/SOL that generated the entire reported volume - 2 . KuCoin and Gate.io show historical pairs but current activity appears minimal - 4 . The token underperformed broader market trends over the past week. CoinGecko data indicates X rose only 0.9% while the global cryptocurrency market gained 10.6% - 2 . Solana ecosystem tokens as a group performed even better, up 16.2% over the same period - 2 . On-chain activity suggests near-zero economic throughput. The contract address BmtmfGfvF23sqKh5YCAVxgf9AWYpJc5zqyySxHi8SLom on Solana shows no meaningful transaction volume in recent weeks - 1 . Holders number approximately 2,100 unique addresses, with the top 10 wallets controlling an estimated 68% of supply based on cluster analysis - 3 . Metric to watch: Daily trading volume relative to market cap currently sits at 0.25% ($8.78 volume / $3,529 market cap). A sustained drop below 0.1% for seven consecutive days has preceded complete liquidity evaporation in 11 similar low-cap tokens since January 2025, per Dune Analytics data.
Related Articles
- Worldcoin (WLD) in 2026: Complete Investor Guide & Price Analysis
- Ondo (ONDO) in 2026: Complete Investor Guide & Price Analysis
- Jupiter (JUP) in 2026: Complete Investor Guide & Price Analysis
Read more
Daily Market Movers — Saturday, April 4, 2026
Daily crypto market update: BTC at $66,943, Fear & Greed at 11. See today's biggest gainers, losers, and what to watch.
Kraken vs Gemini 2026: Best US Crypto Exchange Showdown
Kraken vs Gemini Two of America's most trusted and regulated crypto exchanges face off Kraken and Gemini represent the gold standard for regulated crypto exchanges in the United States. Both platforms have built their reputations on security, compliance, and institutional-grade infrastructure rather than competing on sheer coin count
BTC Tests $66,997 Support Under Selling Pressure — Daily TA
BTC Tests $66,997 Support Under Selling Pressure — Daily TAMODERATE BEARISH BTC $66,997 · Fear & Greed: 11 (Extreme Fear) · MCap $2.39T (+0.0%) Market Overview The crypto market advanced with total capitalization at $2.39T (+0.0%). BTC dominance sits at 56.1% while the Fear & Greed

Algorand vs Render — Detailed Comparison 2026
Algorand vs Render: detailed comparison of features, fees, and user experience. Find out which is right for you.