The Great Unwinding: How to Read Liquidation Data and Survive a Capitulation Event
Learn about The Great Unwinding: How to Read Liquidation Data and Survive a Capitulation Event. Practical guide with tips and FAQ.

In crypto trading, there are "pullbacks," and then there are "events." The week of March 17-20, 2026, was the latter.
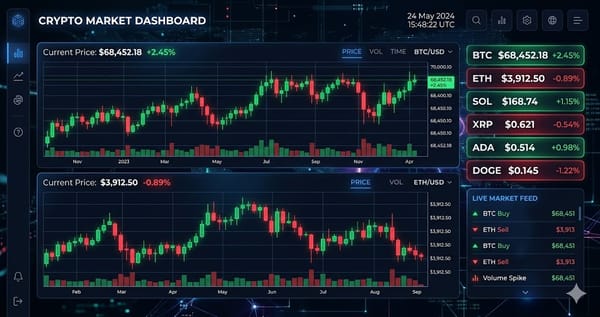
As prices tumbled from the mid-$70,000s to a low of $68,900, the market didn’t just correct—it liquidated. Over $1.5 billion in positions were wiped out in 72 hours. Six of the largest whales on Hyperliquid were completely obliterated, losing an average of $40 million each.
In This Guide
Step-by-Step Guide
Identify the "Liquidity Pools"
Above Price: $71,000-$72,000 (Dense 50x-100x shorts)
Below Price: $68,000 (200-day moving average) and $65,000-$66,000.
Expect the Market to "Seek" Liquidity
Markets often move toward these pools to trigger them. If there is a massive cluster of long liquidations at $68,000, whales and market makers will push the price down to tap that liquidity, fill their orders, and then reverse.
Wait for the Sweep
Look at the March 20 data. The price hit $68,900, just above the $68,000 high-density zone. It did not need to crash to $65,000 to reverse; it simply threatened the major liquidity zone. A bounce from that level, especially with a long lower wick (like a Hammer), is a signal that the liquidation cascade is exhausted.
Trading Rule: Never short after a long liquidation cascade. If the market has already wiped out $1 billion in longs, the fuel for further downward movement is depleted. It is safer to wait for a reversal confirmation than to chase the downside.
Part 3: Interpreting Sentiment Extremes (The Contrarian Edge)
Analyze the Damage (30 minutes post-crash)
Check Total Liquidations: Did we wipe out >$500M in longs? If yes, the immediate downside pressure is reduced.
Check the Heatmap: Did price "sweep" a major liquidity zone (like $68k) and bounce? If yes, a short-term bottom may be in.
Check the Whales: Are "legendary" whales being liquidated? (e.g., the Hyperliquid six). When the largest, most sophisticated players blow up, it often marks the final stage of the capitulation.
Assess the Sentiment (1 hour post-crash)
Fear & Greed: Is the index below 20? If it has been below 20 for multiple days, we are in "despair" territory. This is a zone for accumulation, not panic selling.
Funding Rates: Are funding rates deeply negative (e.g., -0.01% on Binance)? This means shorts are paying to keep their positions open. A squeeze becomes more likely.
Identify the Trade (2-4 hours post-crash)
Stop Hunting: Look for a candle with a long wick (like a Hammer) that broke below support ($68,900) but closed above it.
Volume Profile: Did this reversal happen on high volume? High volume confirms that buyers stepped in to absorb the sell orders.
Entry: If you are a scalper, you can enter a long position just above the wick of the reversal candle, with a stop loss below the wick.
Tips and Best Practices
- Always test with small amounts before committing significant funds.
- Bookmark the official websites of tools mentioned in this guide to avoid phishing.
- Keep detailed records of your transactions for tax reporting purposes.
Ready to start trading?
Trade on Bitget Try CoinTech2uAffiliate links — we may earn a commission at no extra cost to you.
Related Articles
- Best Crypto Copy Trading Platforms in 2026
- Dark Mode Domination: How to Create Crypto Thumbnails That Sell Fear & FOMO
- From Trading Bot to Viral Video: Building an Automated Crypto Market Reactor