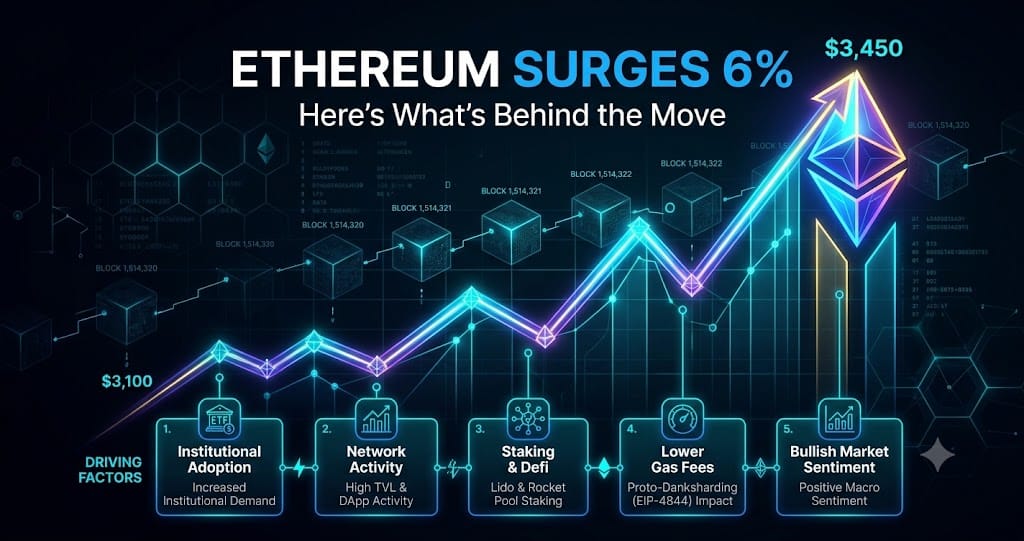
Ethereum Surges 6% — Here's What's Behind the Move
Ethereum (ETH) surged 6%. Analysis of what's driving the move and what to watch next.
PRICE ALERT ANALYSIS — July 3, 2026
Market Snapshot
Bitcoin has staged a sharp recovery, climbing back above **$61,000** after dipping below $60,000-
-
1
. As of this morning, BTC is trading around $61,400–$61,600, up approximately 2.5–4% on the day-
55
-
. Ethereum has followed suit, trading near $1,699, up roughly 5–6% over the past 24 hours-
.
Asset Price 24H Change
Bitcoin (BTC) ~$61,500 +2.5% to +4%
Ethereum (ETH) ~$1,699 +5–6%
Solana (SOL) ~$80.60 +3.7%
XRP ~$1.08 +2.1%
BNB ~$557 +0.8%
-
1
-
Bitcoin dominance sits at approximately 57.9%, indicating capital remains concentrated in BTC rather than rotating broadly into altcoins-
.
What Moved the Market
The Macro Catalyst: Weak U.S. Jobs Data
The primary driver behind today's bounce is U.S. nonfarm payrolls coming in well below expectations. June job additions were just 57,000 versus the anticipated 114,000-
13
-
55
. The unemployment rate held at 4.2%-
13
.
This "cold shock" data has significantly diminished expectations for Federal Reserve rate hikes-
1
. According to CME FedWatch, the probability of a July rate hike has dropped below 30%-
1
. Futures traders now anticipate the next rate hike in December, whereas markets previously expected one in October-
.
For crypto, a less hawkish Fed provides a tailwind for risk assets — lower bond yields reduce the opportunity cost of holding non-yielding assets like Bitcoin-
39
.
The Flip Side: Mixed Signals Beneath the Surface
While price is up, multiple warning signs warrant attention:
1. Massive Exchange Inflows — Bitcoin exchange inflows spiked to roughly 49,000 BTC on June 30, an extreme reading seen only four other times in 2026-
6
. Ethereum inflows exceeded 1.25 million ETH the same week-
6
. More concerning: the average deposit size doubled from 1 BTC to 2 BTC — suggesting whales and institutions, not retail, are moving coins onto exchanges-
6
. Historically, this pattern has preceded directional moves, usually down-
6
.
2. Persistent ETF Outflows — U.S. spot Bitcoin ETFs recorded outflows of $294.62 million** on July 1, extending a streak that saw **$4.5 billion exit in June — the worst month in Bitcoin ETF history-
-
30
.
3. Loss-Making Supply Dominates — Approximately 10.83 million BTC are currently in loss versus 9.22 million in profit — loss-making supply accounts for 54% of the total-
31
. Glassnode views this as one of the steepest deteriorations in investor profitability since the start of the current bull market-
31
.
4. Elevated Volatility Risk — CryptoQuant has flagged rising volatility risk as exchange inflows surge, coinciding with Bitcoin testing the critical $60,000 support level-
.
Key Levels to Watch
Bitcoin (BTC)
Immediate Support: $61,000** — holding this level is critical for sustaining the recovery; below it, **$60,000 is the next line in the sand-
Resistance: $62,137** (today's high)-
13
; above that, **$63,000 becomes the next target-
Bullish Scenario: A sustained break above $62,000 with declining ETF outflows could confirm a short-term bottom-
31
Bearish Scenario: Failure to hold $61,000, especially with exchange inflow data pointing to potential selling pressure, could trigger a retest of $60,000 or lower-
Ethereum (ETH)
Immediate Support: $1,670 — analysts flag this as a critical level-
Resistance: $1,724 (recent high)-
ETH has printed a fresh monthly TD Sequential buy signal and entered a major long-term support zone-
2
, but sustaining above $1,700 remains key
Solana (SOL)
Trading ~$80.60, still approximately **54% below its January high** of $150-
Recent governance system launch requiring minimum 100,000 tokens staked for proposals may provide a structural catalyst-
Institutional & Structural Dynamics
Citi Cuts Forecasts
Citi lowered its 12-month Bitcoin forecast to **$93,000** (from $110,000) and Ether to **$3,600** (from $4,000), citing ETF outflows and regulatory delays-
-
1
.
MicroStrategy/Strategy's New Policy
The world's largest corporate Bitcoin holder (now holding ~847,363 BTC-
) has authorized selling up to $1.25 billion in Bitcoin to fund preferred dividends-
. It already offloaded 32 BTC in late May-
— its first sale since 2022. JPMorgan warns this introduces two-way risk, as the largest corporate buyer could become a seller-
-
. However, Bitwise CIO argues the company has sufficient financial flexibility and is unlikely to be forced into large-scale selling-
.
ETF Flow Divergence
While Bitcoin ETFs bleed, Ethereum ETFs saw net inflows of ~$14.89 million on July 1-
30
, and Solana products also registered small inflows-
30
. This suggests some institutional rotation from BTC into ETH and select altcoins-
.
Liquidations & Leverage
The rebound has triggered significant short liquidations:
~$450 million in shorts liquidated over the past 24 hours-
13
Some reports indicate over $606 million in total leveraged positions wiped out-
XRP's breakout above $1.08 alone triggered **$634 million** in crypto short liquidations-
Warning: Hyperliquid traders' long bias has risen to the highest level in Glassnode's data — meaning traders are using leverage to bet on a rebound before full spot conviction is confirmed-
31
. This crowded long positioning creates vulnerability if ETF outflows persist-
31
.
What to Watch Next
Factor Why It Matters
ETF Flow Data Continued outflows would undermine the recovery; slowing outflows would support a bottoming narrative-
31
Fed Commentary Any pushback against the rate-pause narrative could reverse today's gains-
39
Exchange Inflows If whales continue moving BTC to exchanges, selling pressure could materialize-
6
Regulatory Bill A Senate vote on digital asset legislation looms — banking interests are attempting to derail it-
39
July Seasonality "Green July" is in play after a brutal June, but bears could regain momentum in August-
13
Bottom Line
Today's bounce is macro-driven and real — weaker jobs data has recalibrated Fed expectations in crypto's favor. However, on-chain data tells a more cautious story: whales moving coins to exchanges, record ETF outflows, and loss-making supply at 54% all suggest underlying fragility.
Key takeaway for traders: The $60,000–$62,000 range is the battleground-
6
. Bulls need to see slowing ETF outflows and sustained accumulation by long-term holders to confirm this is more than a short squeeze. Until then, treat this as a relief rally within a volatile consolidation phase — not a confirmed trend reversal.
⚠️ This analysis is for informational purposes only and does not constitute financial advice. Always conduct your own research and manage risk accordingly.
Related Articles
- Uniswap Surges 15% — Here's What's Behind the Move
- Solana Surges 3% — Here's What's Behind the Move
- Daily Market Movers — Thursday, July 2, 2026