Crypto Liquidations in 2026: How $1.8B Long Wipeouts Flipped Into a Short Squeeze
BTC saw four $1B+ liquidation days in June 2026, led by a $1.8B wipeout on June 2. Funding rates then flipped positive after a $450M short squeeze in
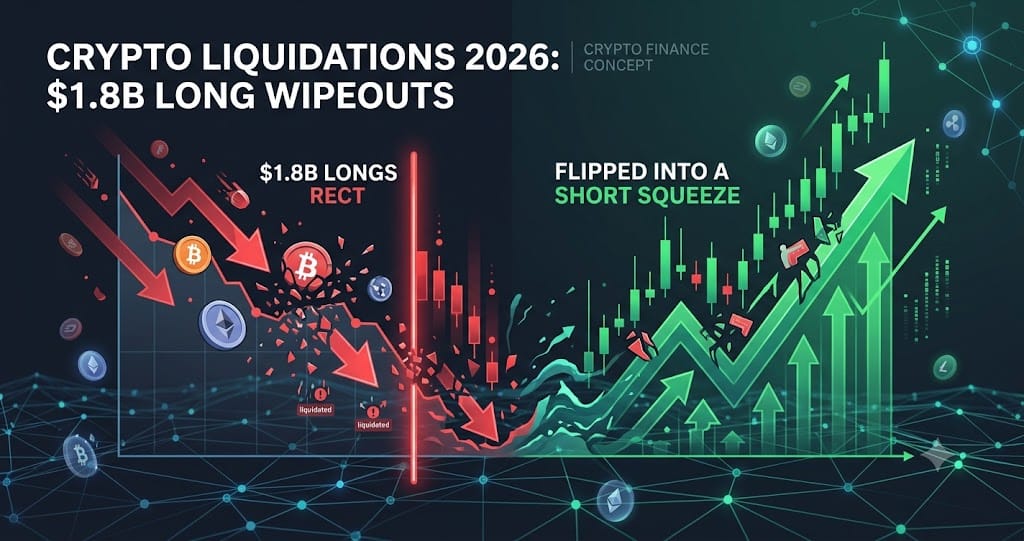
Bitcoin's derivatives market swung from the worst long liquidation cascade of 2026 to a full short squeeze in the span of five weeks. On June 2, 2026, 272,000 traders were liquidated for a combined $1.8 billion in 24 hours, with longs accounting for $1.57 billion of that total against just $215.7 million in shorts.
By July 13, the pattern had fully reversed: BTC funding rates turned positive for two straight days at 0.0048% per 4-hour period (roughly 10.46% annualized), following a July 2 short squeeze that liquidated an estimated $450 million in short positions within 24 hours.
The June 2026 liquidation cascade, event by event
June 2 stands as the largest single-day liquidation event of 2026 so far. Bitcoin Foundation and BitcoinWorld both put the 24-hour total at $1.8 billion, with BTC alone contributing more than $833 million and ETH accounting for close to $480 million. Longs made up roughly 87% of the total, reflecting how one-sided positioning had become after weeks of upside momentum.
The damage did not stop there. Yahoo Finance and BeInCrypto reported a second wave on June 3, with $1.1 billion liquidated in 24 hours as BTC fell toward $60,000 and longs alone lost $945 million. Three weeks later, on June 24, a separate cascade wiped out $994 million, followed just 48 hours after by an even larger event on June 26.
That June 26 flash crash saw BTC drop $3,000 in about one hour, falling to roughly $58,000. CCN, Blockchain Reporter, and FXStreet each confirmed 24-hour liquidations of $1.26 billion across 209,000 traders, with roughly $450 million in long positions wiped out in that single hour. Across the four $1B+ days in June, cumulative long liquidations exceeded $4 billion.
What triggered the cascades: macro, leverage, and liquidity
CCN and Bitcoin Foundation both trace the June cascades to the same macro catalyst: the U.S. May PCE inflation print came in at 4.1% year-over-year, well above the prior 3.8% reading, alongside stronger-than-expected employment data. Together these effectively erased market expectations for near-term rate cuts.
That macro shock landed on top of an already fragile positioning structure, with 10x to 20x leverage common across the market and open interest skewed heavily toward longs. A separate layer of uncertainty came from a Senate vote on proposed banking-sector amendments to crypto legislation, which pushed some traders to reduce exposure ahead of the vote.
The combination created what the research frames as a repeatable three-factor model for large liquidation events: a macro ignition point, an already-leveraged and one-sided market structure, and a liquidity vacuum where thinning buy-side depth lets price crash through clustered stop-loss and margin thresholds, handing control to liquidation engines that accelerate the move.
The reversal: short squeeze and the July liquidation flip
The script flipped in early July. CryptoBriefing and Bitcoin.com News reported that BTC breaking above $62,000 triggered more than $100 million in BTC liquidations in a single day, the large majority on the short side, with total market-wide short liquidations over 24 hours reaching an estimated $450 million to $500 million.
InteractiveCrypto ties the initial breakout to July 2, when a weaker-than-expected non-farm payrolls report combined with dovish Federal Reserve commentary pushed BTC back above $62,000. That move alone triggered roughly $450 million in forced short liquidations in 24 hours, kicking off a short-covering feedback loop of buy-side pressure pushing price higher and triggering further liquidations.
A single $73.17 million short liquidation was recorded on July 6 as part of this squeeze. The net effect was a full 180-degree turn in positioning bias: a market that spent June liquidating longs spent early July liquidating shorts, in what the research describes as a 'kill longs in June, kill shorts in July' two-way squeeze.
Funding rates: from a 46-day negative streak to a positive flip
Before the reversal, BTC perpetual funding rates had been unusually persistent to the downside. Phemex and MEXC News reported that as of April 15, 2026, the 30-day average BTC perpetual funding rate had been negative for 46 consecutive days, the longest negative streak since the November 2022 FTX-collapse bottom, with CryptoQuant data showing readings as deep as -0.011 at points in April.
Exchange-level data showed the negative bias was concentrated on retail-heavy venues. Around late June to early July, WEEX and CoinGlass data put the network-wide 8-hour average funding rate near -0.0015%, while OKX sat at -0.0059% and Bybit at -0.0047%, three to four times deeper than the broader market average.
By July 13, funding had flipped and stayed positive for two consecutive days at 0.0048% per 4-hour period, an estimated 10.46% annualized. Notably, this flip came alongside deleveraging rather than renewed leverage-building: BTC futures open interest sat at $46.71 billion, down 1.06% (about $500 million) over two days, with 24-hour liquidations of just $12.73 million, 74.5% of which were longs, a comparatively calm and orderly structure relative to the June and early-July events.
What to Watch
- BTC futures open interest, currently around $46.71-47.41 billion per CoinGlass, for signs of renewed leverage build-up after the recent deleveraging
- Funding rate direction across major exchanges (OKX, Bybit) since retail venues have historically shown 3-4x deeper deviations than the network average
- Upcoming U.S. inflation and employment prints, given that the May PCE reading of 4.1% YoY was the direct catalyst for the June liquidation cascades
- Options market positioning, with a flat skew and reported put buying near $52,000 suggesting traders remain skeptical of the current rebound
- Clustering of stop-loss and margin thresholds around round-number price levels, which has repeatedly acted as the microstructure accelerant in past cascades
Ready to start trading?
Trade on Bitget Try CoinTech2uAffiliate links — we may earn a commission at no extra cost to you.
Related Articles
- Privacy Coins Roar Back as Zcash Rallies 13% Ahead of Ironwood Upgrade
- Bitcoin's 2026 Volatility Cycle: DVOL Compression Before the Liquidation Cascades
- SEC Regulation Crypto and Robinhood Chain Meme Mania: Crypto Week July 2026
Frequently Asked Questions
What was the largest crypto liquidation event of 2026 so far?
June 2, 2026 was the largest single-day liquidation event of the year, with $1.8 billion liquidated in 24 hours across 272,000 traders. Longs accounted for about $1.57 billion of that total, or roughly 87%, with BTC contributing over $833 million and ETH close to $480 million.
Why did Bitcoin's price crash repeatedly in June 2026?
Each cascade followed a similar pattern: the May PCE inflation report at 4.1% year-over-year, above the prior 3.8%, combined with strong employment data to erase rate-cut expectations. This hit an already one-sided market running 10x to 20x leverage, and thinning liquidity let price break through clustered stop-loss levels, triggering automated liquidation engines.
Have crypto funding rates turned positive after months of negative readings?
Yes. After a 46-day negative streak in BTC perpetual funding through mid-April 2026, the rate flipped positive following a July 2 short squeeze that liquidated an estimated $450 million in short positions. As of July 13, funding sat at 0.0048% per 4-hour period, about 10.46% annualized, alongside falling open interest.