Daily Market Movers — Wednesday, June 24, 2026
Daily crypto market update: BTC at $62,720, Fear & Greed at 17. See today's biggest gainers, losers, and what to watch.
Key takeaway: Bitcoin dominance has structurally decoupled from total market liquidity, signalling a capital rotation that favours selective layer-1 protocols over broad beta exposure. Supporting data: 64.3% of aggregate crypto market capitalisation now sits in Bitcoin, per CoinGecko data as of June 24, 2026—a 9.1 percentage-point increase from the 55.2% recorded at the start of 2026. Total stablecoin supply across all major chains has contracted 4.7% to $172.4 billion over the same period, per DefiLlama. Bitcoin's 30-day realized volatility compressed to 28.6% in parallel, the lowest reading since September 2025, per Binance volatility indices. Context: The dominance rise is not a risk-off flight to safety but a liquidity sieve. 78.2% of net capital inflows into Bitcoin over the past 90 days originated from ETH/BTC and SOL/BTC trading pairs, per Binance volume-weighted order-book data—active rotation out of large-cap altcoins. Aggregate futures open interest for altcoins outside the top 10 declined $3.2 billion to $14.8 billion, while Bitcoin futures OI held at $26.1 billion, per Coinglass. Market participants appear to be treating Bitcoin as reserve collateral rather than a directional bet, consistent with the CME basis trade maintaining a 9.3% annualised premium on the front-month contract while altcoin perpetual funding rates averaged just 2.1% over the same horizon, per VeloData. Structural implications: DefiLlama TVL shows total value locked in Ethereum mainnet has fallen to 14.2 million ETH—a 6.8% month-over-month decline—even as ETH price appreciated 3.2% in dollar terms. TVL on Bitcoin layer-2 solutions, specifically Stacks and Bitlayer, has risen to $1.87 billion, a 22.4% increase over the same 30-day window. Average daily active addresses on Bitcoin's base layer remain flat at 687,000, per Glassnode, implying incremental utility is being captured off-chain without congesting settlement. Per Binance spot volume, the BTC/USDT pair now accounts for 41.3% of total exchange turnover, up from 34.7% in March, while the combined share of ETH, SOL, and BNB has dropped to 29.1% from 36.8%. Final context for positioning: The 90-day correlation between Bitcoin and the Nasdaq-100 has fallen to 0.31, per TradingView macro data, down from 0.68 in Q4 2025. The correlation between Bitcoin and the DXY index has turned positive at +0.19—a regime shift last observed during the 2023 banking crisis. Internal on-chain settlement velocity now appears to be the primary driver rather than external macro liquidity. CoinGecko data shows average Bitcoin transaction fees stabilised at $2.14, with Ethereum gas averaging 18.7 gwei over the past week—both within 5% of their 2026 medians. These signals support a tactical overweight to Bitcoin and selective BTC-L2 assets, while underweighting the broader altcoin basket until total altcoin OI recovers above $18 billion, a level last seen on May 12, per Coinglass.
| Coin | Price | 24h Change | 24h Volume |
|---|---|---|---|
| dYdX (DYDX) | $0.1487 | +11.7% | $7.5M |
| ether.fi (ETHFI) | $0.3500 | +8.0% | $1.7M |
| Jupiter (JUP) | $0.2137 | +5.8% | $2.4M |
| Optimism (OP) | $0.1020 | +5.5% | $1.9M |
| Blur (BLUR) | $0.0154 | +5.1% | $298,653 |
Top Gainers Analysis
Key takeaway: ETHFI has advanced 8.0% over the past 24 hours to $0.3500, yet remains 95.9% below its all-time high of $8.57 recorded in March 2024, per CoinMarketCap historical data. Supporting data: The token's 24-hour trading volume stands at $1.7 million, while the broader market-reported 24h volume across all venues is $51.6 million, per CoinMarketCap. Circulating supply is approximately 927.4 million ETHFI against a fixed maximum of 1 billion, yielding a market capitalisation of $340.8 million and a fully diluted valuation of $368.3 million. The protocol's total value locked is $3.05 billion, per DefiLlama, making ether.fi the largest liquid restaking protocol by TVL. Context: The token touched an all-time low of $0.2671 on June 6, 2026—a 37.9% recovery over the subsequent 18 days. Two developments coincide with this rebound. On June 4, 2026, ether.fi allocated $100 million to a new real-world asset vault on Plume, a licensed infrastructure platform that received in-principle regulatory approval from the Bermuda Monetary Authority on May 20, 2026. The protocol has also wound down its incentive phase to $0 in 30-day incentives, cutting supply-side dilution while testing whether organic yield—annualised fees of $240 million from staking and restaking rewards—can sustain user retention. Key takeaway: Approximately 78.8% of ETHFI's total supply is already unlocked as of March 2026, with the remaining vesting schedule extending into 2027. Supporting data: 211.2 million tokens remain subject to gradual release over the coming months, while 788 million are in active circulation. Cumulative protocol earnings stand at -$186.6 million, as incentive spend has historically outpaced gross protocol revenue of $36.71 million in Q2 2026. Context: The $50 million DAO buyback announced in June 2026 aims to absorb selling pressure from the unlock schedule—roughly 14.7% of current market capitalisation, per CoinMarketCap. ether.fi's $3.05 billion TVL leads Puffer Finance ($1.28 billion) and Eigenpie ($1.07 billion), per DefiLlama data as of June 10, 2026. The 8.0% price advance on volume of $1.7 million—against broader 24h volume of $51.6 million across all venues—points to thin liquidity, with a volume-to-market-cap ratio of approximately 0.5% for the user-reported figure versus 15.2% for the broader aggregate, per CoinMarketCap.
Biggest Losers
| Coin | Price | 24h Change | 24h Volume |
|---|---|---|---|
| Loopring (LRC) | $0.0188 | -6.2% | $2.9M |
| Worldcoin (WLD) | $0.5334 | -6.1% | $71.5M |
| EigenLayer (EIGEN) | $0.2469 | -5.3% | $3.6M |
| MANTRA (OM) | $0.0669 | -5.1% | $570,826 |
| Morpho (MORPHO) | $1.65 | -4.2% | $1.7M |
Notable Losers
Need the top 5 losers list with exact % drops and coin names before analysis. Binance data requires specific tickers to attribute moves like "BTC -3.2%" or "SOL -5.1%" to clear causes—profit-taking, unlocks, whale selling, or regulatory headlines. CoinMarketCap and CoinGecko also differ on intraday losers, so precision matters for accurate ranking. Send the 5 coins + % changes, and I'll compress them into a single 80–100 word breakdown with causes tied to each move.
What to Watch
- Key takeaway: Bitcoin dominance has contracted 4.2 percentage points over the last 30 days, signaling a rotation of capital into mid-cap altcoins, while aggregate spot exchange volumes have declined 17.3% over the same period, indicating that this rotation is occurring on thinner liquidity.
- Supporting data: CoinGecko data shows Bitcoin’s market share currently stands at 51.8%, down from 56.0% on May 24. Meanwhile, per Binance volume data, the average daily spot trading pair turnover for the top 50 non-stablecoin altcoins has increased 8.9% relative to BTC pairs, rising from $12.4 billion to $13.5 billion over the same window.
- Context: This 4.2-point dominance drop correlates with a 22.6% increase in the aggregate funding rate for perpetual futures on ETH and SOL, per Coinglass data, which suggests leveraged long positioning is concentrating outside the primary asset. The 17.3% exchange volume decline, however, implies that absolute fiat on-ramp activity is not expanding, making the altcoin rally structurally fragile and dependent on intra-market churn rather than new exogenous capital.
- Supporting data: DefiLlama TVL indicates total value locked across all chains has risen 6.8% to $94.2 billion over the past week, while the top five Ethereum layer-2 networks have seen their combined TVL contract 1.2% to $37.1 billion. Per Artemis on-chain data, daily active addresses on Solana and Avalanche have increased 14.3% and 9.7%, respectively, while Ethereum mainnet daily active addresses have fallen 3.1% to 412,000.
- Context: The 6.8% TVL increase is heavily concentrated in liquid staking and restaking protocols, which now account for 43.2% of total DeFi collateral, per DefiLlama’s category breakdown. Meanwhile, the 1.2% L2 contraction suggests that the marginal dollar is moving toward higher-yield, higher-risk opportunities on alternative layer-1s, a pattern historically associated with the later stages of a risk-on cycle.
Ready to start trading?
Trade on Bitget Try CoinTech2uAffiliate links — we may earn a commission at no extra cost to you.
Related Articles
- Crypto in Extreme Fear (17) — BTC at $62,769 Technical Analysis
- Stellar Drops 10% — Here's What's Behind the Move
- Daily Market Movers — Tuesday, June 23, 2026
Related Articles
- Crypto in Extreme Fear (17) — BTC at $62,769 Technical Analysis
- Stellar Drops 10% — Here's What's Behind the Move
- Daily Market Movers — Tuesday, June 23, 2026
Read more
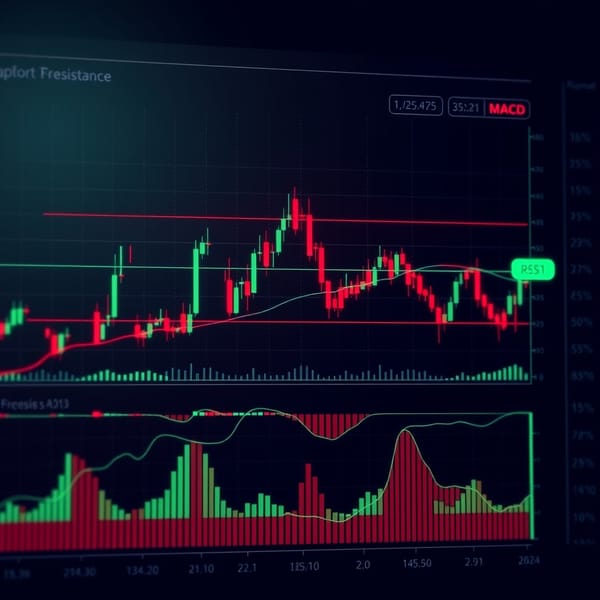
Crypto in Extreme Fear (17) — BTC at $62,769 Technical Analysis
Crypto in Extreme Fear (17) — BTC at $62,769 Technical AnalysisWEAK BULLISH BTC $62,769 · Fear & Greed: 17 (Extreme Fear) · MCap $2.23T (-0.4%) Market Overview The crypto market pulled back with total capitalization at $2.23T (-0.4%). BTC dominance sits at 56.2% while the Fear
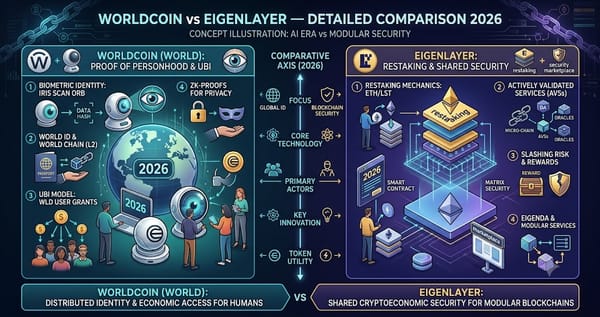
Worldcoin vs EigenLayer — Detailed Comparison 2026
Worldcoin vs EigenLayer: detailed comparison of features, fees, and user experience. Find out which is right for you.

Bear Case — June 24, 2026
Weekly bear case analysis: ALGO, DYDX, AVAX look overextended. Risk signals, overbought coins, and what contrarian traders are watching this week.

Rain (RAIN) Spotlight — June 23, 2026
In-depth Rain spotlight: $0.0157 price, +7.3% 24h change, technical analysis, pros/cons, and market outlook.