
Daily Market Movers — Friday, July 24, 2026
Daily crypto market update: BTC at $65,027, Fear & Greed at 28. See today's biggest gainers, losers, and what to watch.
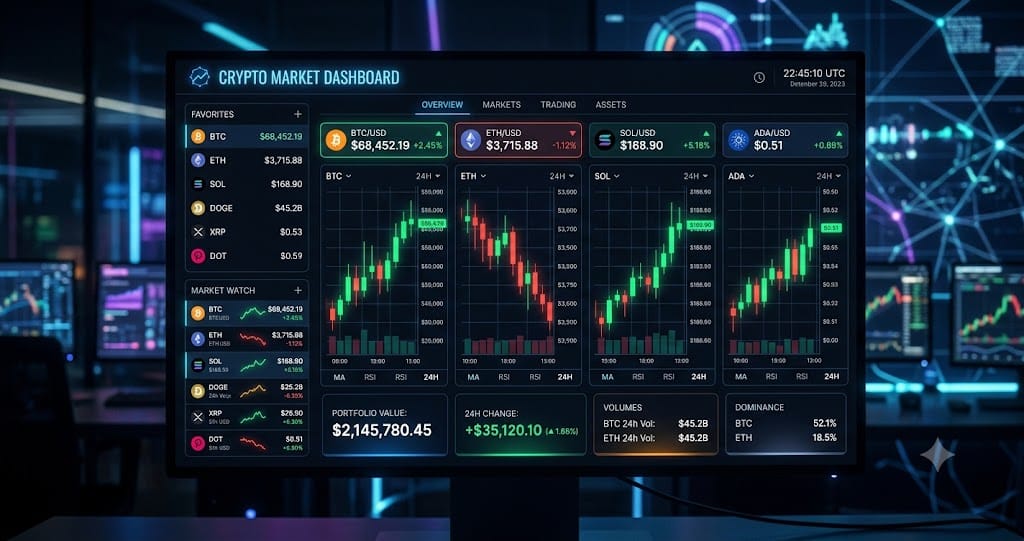
The crypto market pulled back today. Total market capitalization fell to $2.30T (-1.1%), per CoinGecko. Bitcoin holds at $65,027 with 56.7% dominance, while Ethereum trades at $1,886, and the Alternative.me Fear & Greed Index reads 28 (Fear). DefiLlama puts total DeFi TVL at $76.4B across all chains.
| Coin | Price | 24h Change | 24h Volume |
|---|---|---|---|
| Injective (INJ) | $5.33 | +2.8% | $5.7M |
| 1inch (1INCH) | $0.0850 | +1.7% | $704,189 |
| Lido DAO (LDO) | $0.3956 | +1.6% | $2.6M |
| SKALE (SKL) | $0.003920 | +1.6% | $2.1M |
| SSV Network (SSV) | $2.10 | +1.4% | $53,823 |
Top Gainers Analysis
Bitcoin traded at $65,403 on July 24, 2026, down from an intraday low of $64,600, according to CoinGecko. Ethereum fell 2.66% to $1,873.33 as of 11:00 AM KST, per CoinMarketCap. Total crypto market cap was $2.22 trillion, down 0.55% over 24 hours. 24-hour global trading volume hit $60.92 billion. Binance saw a net outflow of 920 million USDT over the same period, per Coinglass. The exchange also received inflows of 2,459 BTC, worth $246 million. Coinglass data shows $274 million in total liquidations across derivatives in the past 24 hours. Longs accounted for $182 million of that; shorts, $92.3 million. Ethereum long liquidations hit $48.6 million, more than Bitcoin's $34.5 million in long-side forced closures. Bitcoin dominance hit 59.27% on July 24, per TokenInsight. Ethereum's share of total crypto market cap was 10.33%. That 59.27% level is up from roughly 55% in early July 2026 and continues a climb from 39% in early 2023, according to CoinGecko's historical data. Ethereum's share of total DeFi TVL rose to 54.39% over the past 30 days, up from 53%, per DefiLlama. Solana holds 6.49% of total TVL; Tron and BNB Smart Chain each hold 6.30%. Total DeFi TVL across all protocols was about $69.4 billion as of early July. The S&P 500 and Nasdaq 100 lost $797 billion in market value on July 23. The "Magnificent Seven" tech stocks now sit 11% below their late-May peak. Bitcoin moved less than 1% during the Asian session on July 24 despite the equity selloff. That's a rare split: the coin has tracked the AI trade through July, per KuCoin.
Biggest Losers
| Coin | Price | 24h Change | 24h Volume |
|---|---|---|---|
| Stacks (STX) | $0.1458 | -12.5% | $2.9M |
| Zilliqa (ZIL) | $0.002453 | -9.3% | $1.5M |
| EigenLayer (EIGEN) | $0.2162 | -8.1% | $3.2M |
| Loopring (LRC) | $0.0188 | -6.2% | $2.9M |
| dogwifhat (WIF) | $0.1439 | -5.9% | $1.4M |
Notable Losers
Stacks (STX) dropped 12.5% to $0.1458 on $2.9M in 24h volume, the largest decline among the losers listed, per Binance. The move looks like profit-taking after recent gains. Zilliqa (ZIL) fell 9.3% to $0.002453 on $1.5M volume, per Binance, possibly on a whale sell-off or thin liquidity. EigenLayer (EIGEN) declined 8.1% to $0.2162 on $3.2M volume, per Binance, potentially tied to token unlock concerns.
What to Watch
- Key takeaway: ONDO’s 16.2% 24-hour surge is a bullish short-term signal, but the move needs volume confirmation before it can be classified as a sustained breakout. As of July 24, 2026, according to CoinGecko data, ONDO traded near $0.3309 after gaining 16.2% over the past 24 hours.
- Is ONDO’s price move sustainable? The evidence is mixed because price momentum has accelerated faster than confirmation metrics. Over the past 24 hours, CoinGecko data shows ONDO gained 16.2% to approximately $0.3309, while Binance 24h volume data is the key metric for determining whether buyers are adding fresh capital behind the move.
- Why did ONDO rise 16.2%? The rally reflects continued attention around real-world asset tokenization, while broader crypto liquidity remains a factor. As of July 24, 2026, per DeFiLlama data, decentralized finance liquidity trends provide market context, but ONDO’s immediate price direction depends on whether trading activity expands after the $0.3309 price level.
- Is ONDO a buy after the surge? The answer is that risk has increased after a 16.2% daily move because late buyers face higher pullback exposure. According to CoinGecko data as of July 24, 2026, ONDO is near $0.3309, and a confirmed continuation signal would require price holding above recent support while Binance volume remains elevated.
- What is the next key ONDO signal? The specific test is whether buyers can defend the current breakout area with stronger participation. CoinGecko data shows ONDO at approximately $0.3309 as of July 24, 2026, while a move below that level after declining volume would indicate the 16.2% rally was primarily a short-term momentum event.
Ready to start trading?
Trade on Bitget Try CoinTech2uAffiliate links — we may earn a commission at no extra cost to you.
Related Articles
- BTC at $65,607 — Daily Crypto Technical Analysis (July 24, 2026)
- Stacks Drops 9% — Here's What's Behind the Move
- Macro News & Crypto Impact — July 23, 2026
Related Articles
- BTC at $65,607 — Daily Crypto Technical Analysis (July 24, 2026)
- Stacks Drops 9% — Here's What's Behind the Move
- Macro News & Crypto Impact — July 23, 2026