Crypto in Extreme Fear (16) — BTC at $71,598 Technical Analysis
CONFLICTED NEUTRAL BTC $71,598 · Fear & Greed: 16 (Extreme Fear) · MCap $2.51T (-1.2%) Market Overview The crypto market pulled back with total capitalization at $2.51T (-1.2%).
Market Overview
The crypto market pulled back with total capitalization at $2.51T (-1.2%). BTC dominance sits at 57.1% while the Fear & Greed Index reads 16 (Extreme Fear), reflecting cautious sentiment.
Bitcoin (BTC) — $71,598
● CONFLICTED NEUTRAL (Score: 10)
Price Action & Key Levels
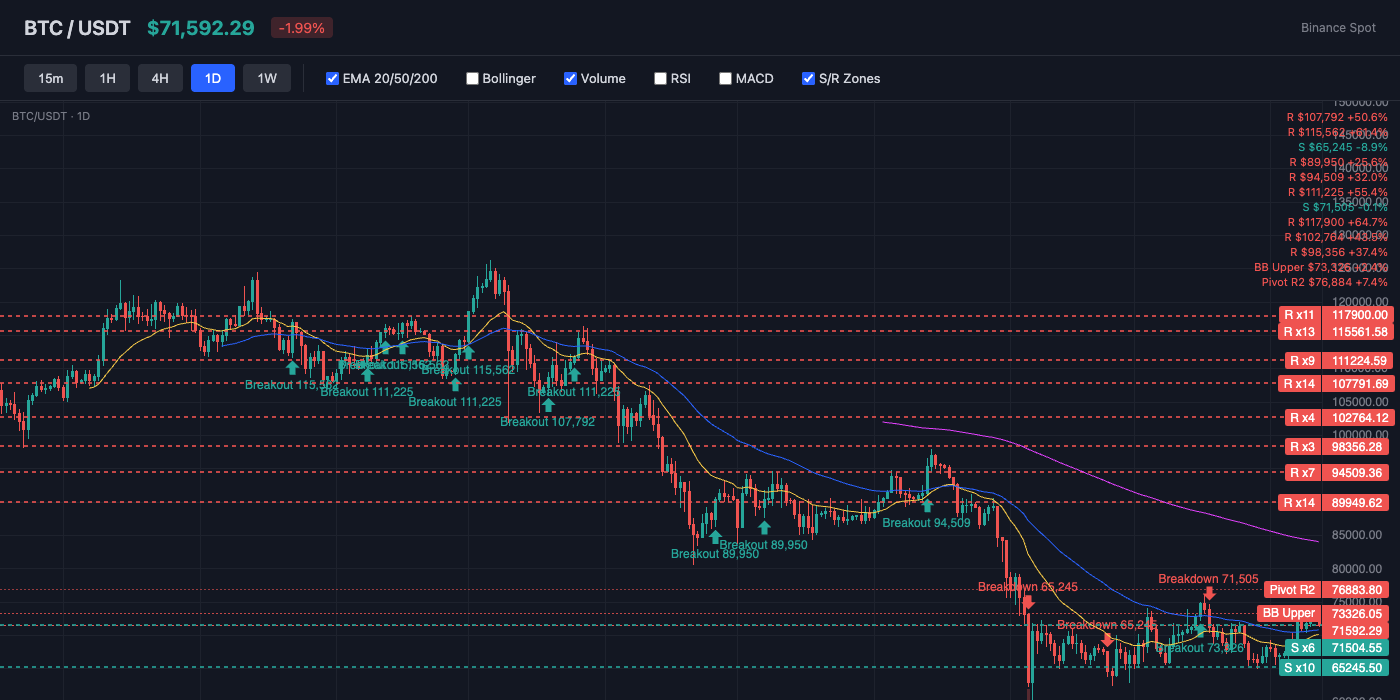
Bitcoin trades at $71,598, currently above the 20-day EMA ($70,155) and above the 50-day EMA ($70,678). The 200-day EMA at $85,761 serves as long-term resistance. Key resistance sits at $73,326 (BB Upper), while support holds at $70,155 (EMA20). EMAs are stacked bearishly (20 < 50 < 200), indicating a sustained downtrend.
Bollinger Bands & Volatility
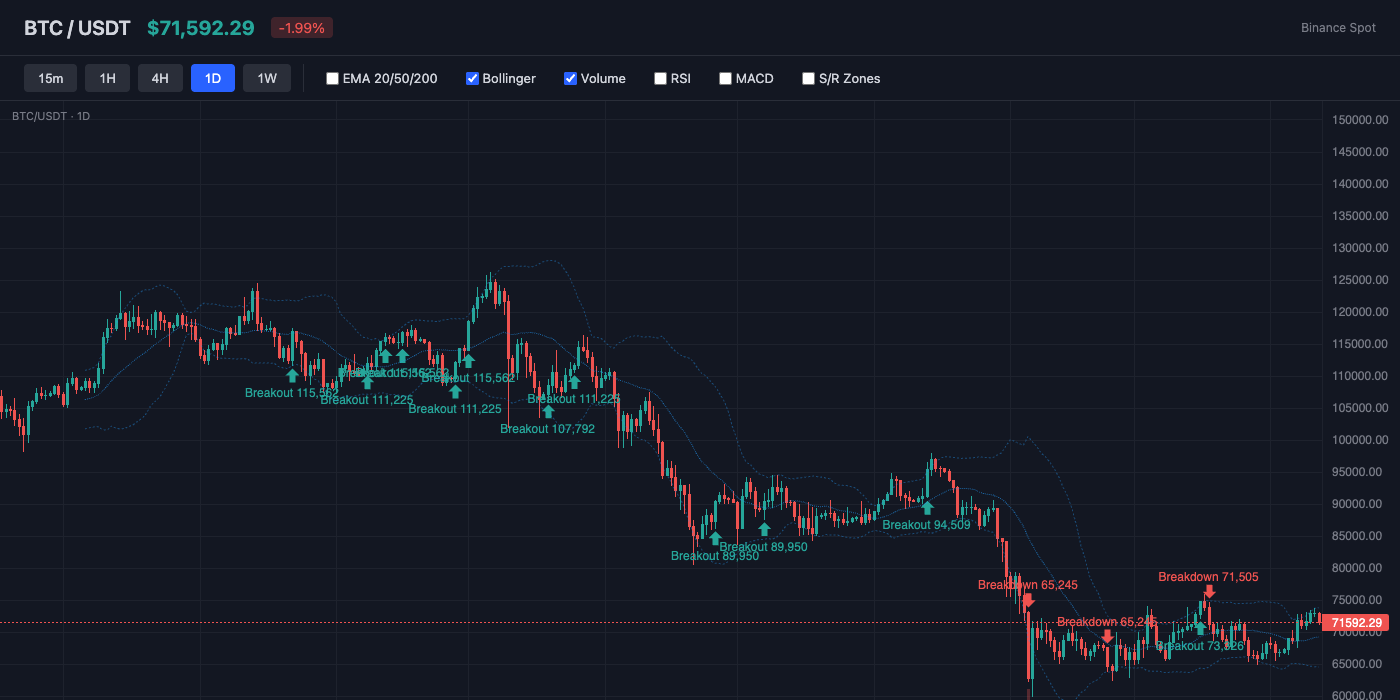
Bollinger Bands show a bandwidth of 12.6% (moderate volatility). Price sits near the upper band (%B: 80%), suggesting overbought conditions or strong bullish momentum. The middle band (SMA 20) at $68,980 acts as dynamic support.
Momentum Indicators
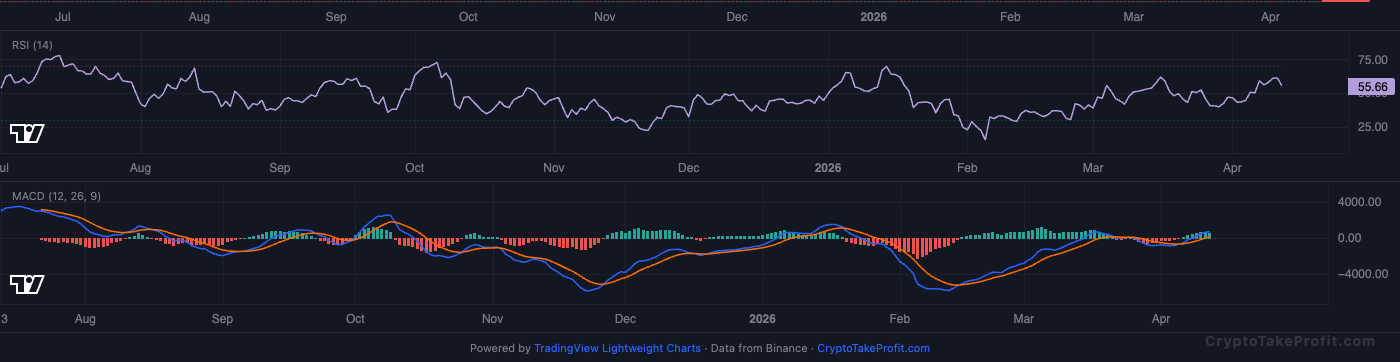
RSI reads 55.6, sitting in neutral range with no extreme readings. MACD has no active crossover, with positive histogram (600.01) indicating upward momentum.
Market Structure
BTC is trading at $71,598 with a conflicted neutral bias.
Volume Analysis
Volume is at 0.52x the 20-day average, indicating normal activity.
Key Levels
| Price | Type | Source | Significance | Distance |
|---|---|---|---|---|
| $79,963 | Resistance | Pivot R3 | Low | +11.7% |
| $76,884 | Resistance | Pivot R2 | Medium | +7.4% |
| $74,241 | Resistance | Pivot R1 | Medium | +3.7% |
| $73,326 | Resistance | BB Upper | Low | +2.4% |
| $71,598 | Current | — | — | — |
| $70,155 | Support | EMA20 | Low | -2.0% |
| $68,519 | Support | Pivot S1 | Medium | -4.3% |
| $65,440 | Support | Pivot S2 | Medium | -8.6% |
| $62,797 | Support | Pivot S3 | Low | -12.3% |
Moving Averages
| MA | Value | Position | Signal |
|---|---|---|---|
| EMA 20 | $70,155 | Above | Bullish |
| EMA 50 | $70,678 | Above | Bullish |
| EMA 200 | $85,761 | Below | Bearish |
| BB Middle (SMA 20) | $68,980 | Above | Bullish |
Trade Setup
BTC Scenario Analysis
Bullish Case
Trigger: N/A
Target: N/A
Invalidation: N/A
Base Case
Trigger: N/A
Target: N/A
Invalidation: N/A
Bearish Case
Trigger: N/A
Target: N/A
Invalidation: N/A
Bitcoin (BTC) Resources
Altcoin Overview
Among altcoins, ETH leads with the strongest bullish signal (score: 15), while ADA shows the weakest setup (score: -15). Traders should focus on coins with clear directional signals and volume confirmation.
What to Watch
- BTC action around $71,598 for directional confirmation
- Fear & Greed at 16 for sentiment shift signals
- MACD crossover follow-through on top altcoins
- Volume confirmation on any support/resistance breaks
- BTC dominance at 57.1% for alt rotation signals


