BTC at $74,603 — Daily Crypto Technical Analysis (April 14, 2026)
CONFLICTED NEUTRAL BTC $74,603 · Fear & Greed: 21 (Extreme Fear) · MCap $2.61T (+4.3%) Market Overview The crypto market advanced with total capitalization at $2.61T (+4.3%).
Market Overview
The crypto market advanced with total capitalization at $2.61T (+4.3%). BTC dominance sits at 57.3% while the Fear & Greed Index reads 21 (Extreme Fear), reflecting cautious sentiment.
Bitcoin (BTC) — $74,603
● CONFLICTED NEUTRAL (Score: -2)
Price Action & Key Levels
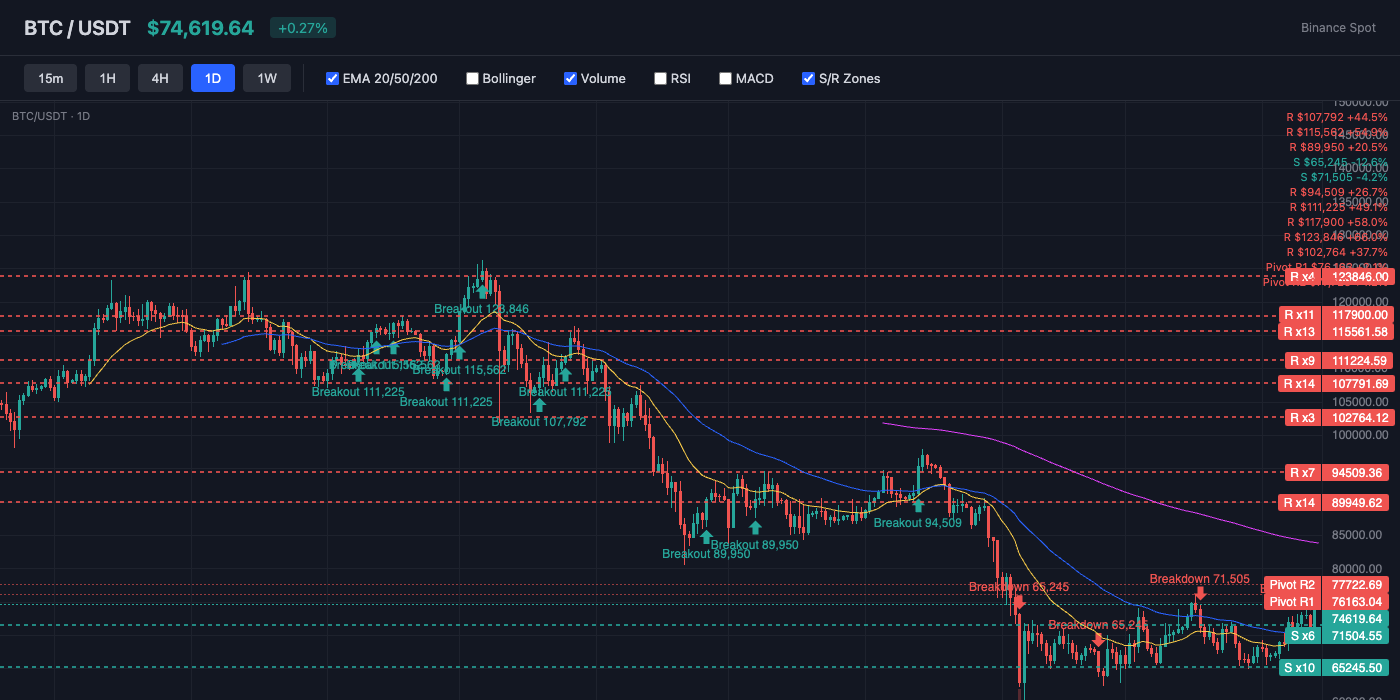
Bitcoin trades at $74,603, currently above the 20-day EMA ($70,683) and above the 50-day EMA ($70,852). The 200-day EMA at $85,573 serves as long-term resistance. Key resistance sits at $76,163 (Pivot R1), while support holds at $74,248 (BB Upper). EMAs are stacked bearishly (20 < 50 < 200), indicating a sustained downtrend.
Bollinger Bands & Volatility
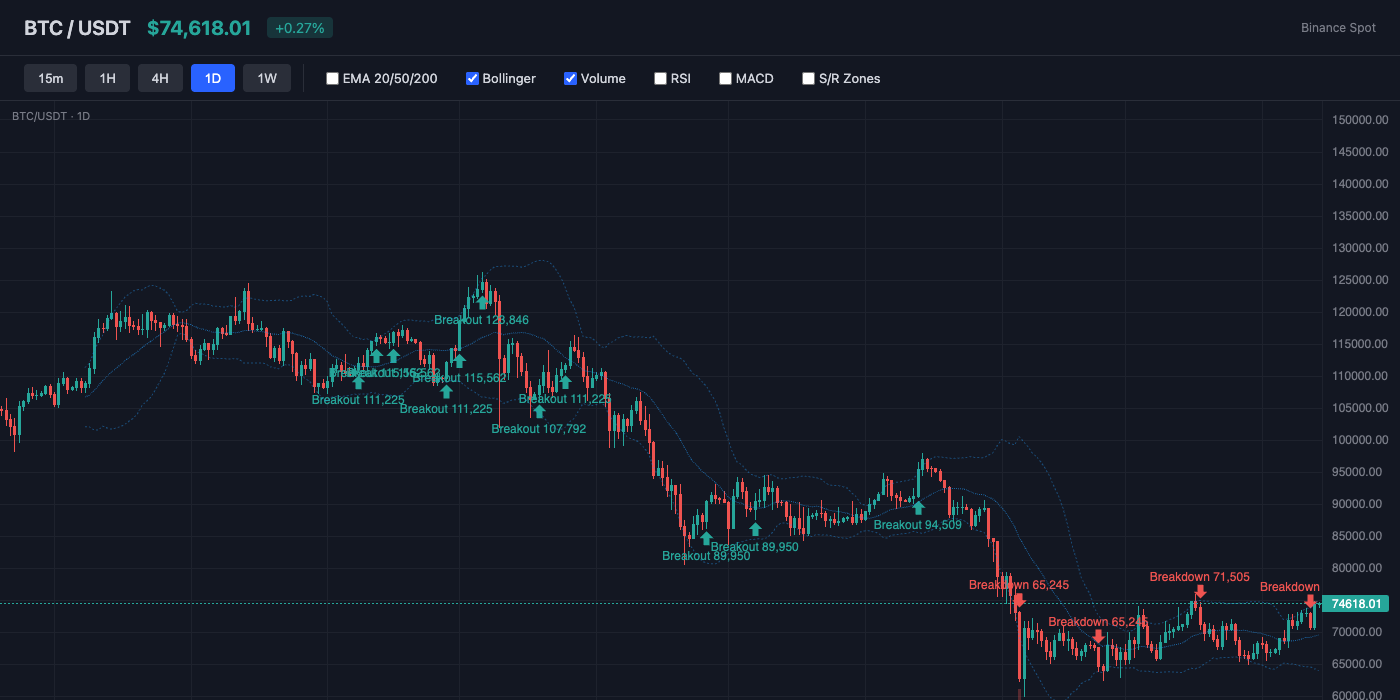
Bollinger Bands show a bandwidth of 14.5% (moderate volatility). Price sits near the upper band (%B: 104%), suggesting overbought conditions or strong bullish momentum. The middle band (SMA 20) at $69,233 acts as dynamic support.
Momentum Indicators
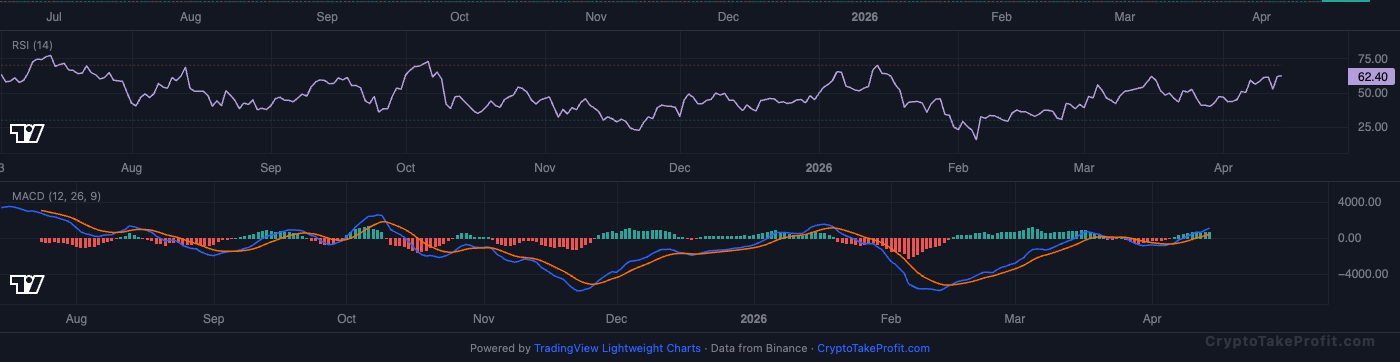
RSI reads 62.1, leaning bullish with room to run before reaching overbought. MACD has no active crossover, with positive histogram (633.52) indicating upward momentum.
Market Structure
BTC trades at $74,603 as of April 14, 2026, holding above both EMA20 ($70,683) and EMA50 ($70,852), which confirms a short-term uptrend despite a -2 conflicted signal. RSI at 62.1 shows momentum is bullish but not overheated, while BB %B at 103.5% indicates price is already pushing above the upper band, a condition that often precedes either continuation or short-term exhaustion.
Volume Analysis
Volume is 1.28x above average as of April 14, 2026, confirming real participation behind the move rather than thin liquidity. Open interest at 94,913 contracts with a long/short ratio of 0.90 shows more shorts than longs, which creates squeeze potential if price continues higher.
Key Levels
| Price | Type | Source | Significance | Distance |
|---|---|---|---|---|
| $85,573 | Resistance | EMA200 | High | +14.7% |
| $80,551 | Resistance | Pivot R3 | Low | +8.0% |
| $77,723 | Resistance | Pivot R2 | Medium | +4.2% |
| $76,163 | Resistance | Pivot R1 | Medium | +2.1% |
| $74,603 | Current | — | — | — |
| $74,248 | Support | BB Upper | Low | -0.5% |
| $71,775 | Support | Pivot S1 | Medium | -3.8% |
| $70,683 | Support | EMA20 | Low | -5.3% |
| $68,947 | Support | Pivot S2 | Medium | -7.6% |
Moving Averages
| MA | Value | Position | Signal |
|---|---|---|---|
| EMA 20 | $70,683 | Above | Bullish |
| EMA 50 | $70,852 | Above | Bullish |
| EMA 200 | $85,573 | Below | Bearish |
| BB Middle (SMA 20) | $69,233 | Above | Bullish |
Trade Setup
BTC Scenario Analysis
Bullish Case
Trigger: Break and hold above $76,163 (Pivot R1) on rising volume above 1.3x
Target: $78,500 (extension of ATR $2,515 above resistance)
Invalidation: Drop below $74,248 with volume falling below 1.0x
BTC is in a squeeze-prone setup because the long/short ratio sits at 0.90 as of April 14, 2026, meaning shorts are crowded. A clean break above $76,163 forces liquidations and pushes price toward $78,500.
Base Case
Trigger: Price holds between $74,248 and $76,163 with RSI staying between 55–65
Target: $74,200–$76,200 range
Invalidation: Daily close above $76,163 or below $74,248
BTC consolidates after a +4.3% market cap increase to $2.61T as of April 14, 2026, absorbing recent gains without trend expansion. BB %B at 103.5% suggests price is stretched, so sideways movement resets momentum before the next move.
Bearish Case
Trigger: Breakdown below $74,248 (BB Upper) with volume above 1.3x
Target: N/A
Invalidation: N/A
Bitcoin (BTC) Resources
Altcoin Overview
Among altcoins, BNB leads with the strongest bullish signal (score: 25), while ADA shows the weakest setup (score: -15). Traders should focus on coins with clear directional signals and volume confirmation.
What to Watch
- BTC action around $74,603 for directional confirmation
- Fear & Greed at 21 for sentiment shift signals
- MACD crossover follow-through on top altcoins
- Volume confirmation on any support/resistance breaks
- BTC dominance at 57.3% for alt rotation signals


