BTC at $74,966 — Daily Crypto Technical Analysis (April 16, 2026)
CONFLICTED NEUTRAL BTC $74,966 · Fear & Greed: 23 (Extreme Fear) · MCap $2.62T (+1.7%) Market Overview The crypto market advanced with total capitalization at $2.62T (+1.7%).
Market Overview
The crypto market advanced with total capitalization at $2.62T (+1.7%). BTC dominance sits at 57.2% while the Fear & Greed Index reads 23 (Extreme Fear), reflecting cautious sentiment.
Bitcoin (BTC) — $74,966
● CONFLICTED NEUTRAL (Score: 13)
Price Action & Key Levels
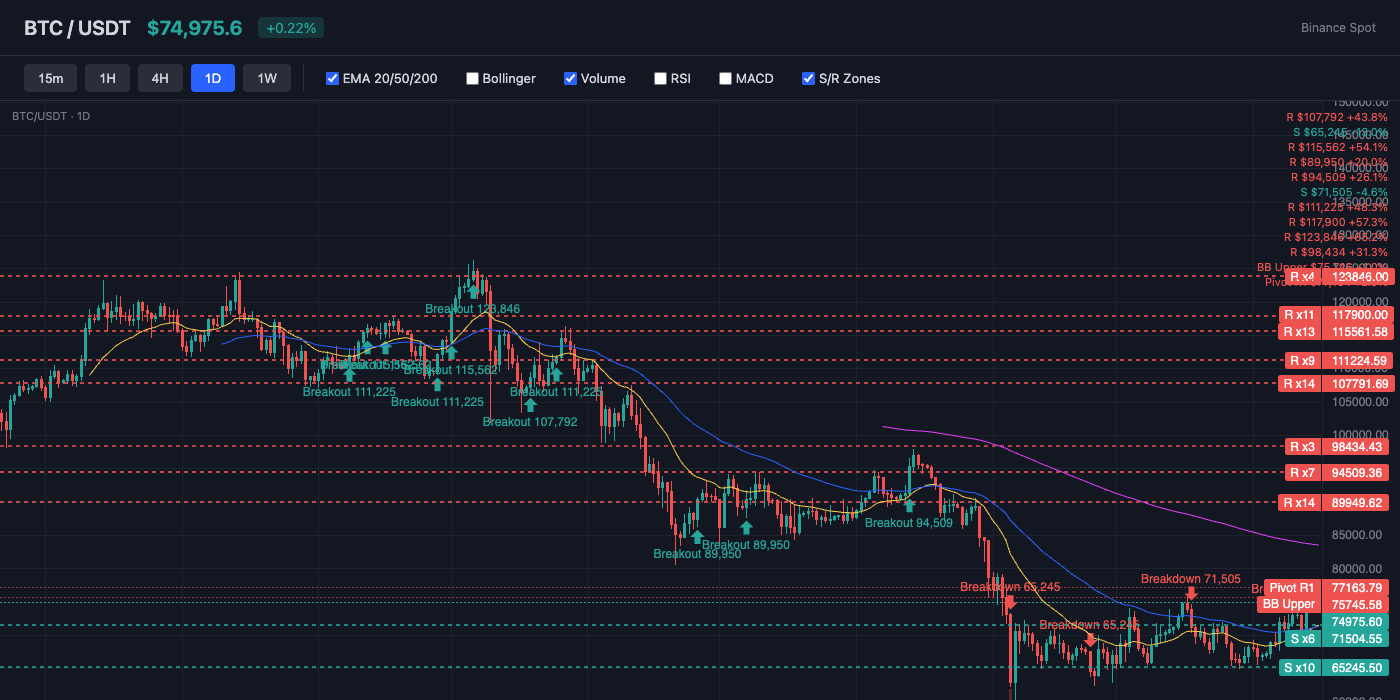
Bitcoin trades at $74,966, currently above the 20-day EMA ($71,261) and above the 50-day EMA ($71,151). The 200-day EMA at $85,414 serves as long-term resistance. Key resistance sits at $75,746 (BB Upper), while support holds at $71,637 (Pivot S1). EMA alignment is mixed, suggesting a transitional or ranging market.
Bollinger Bands & Volatility
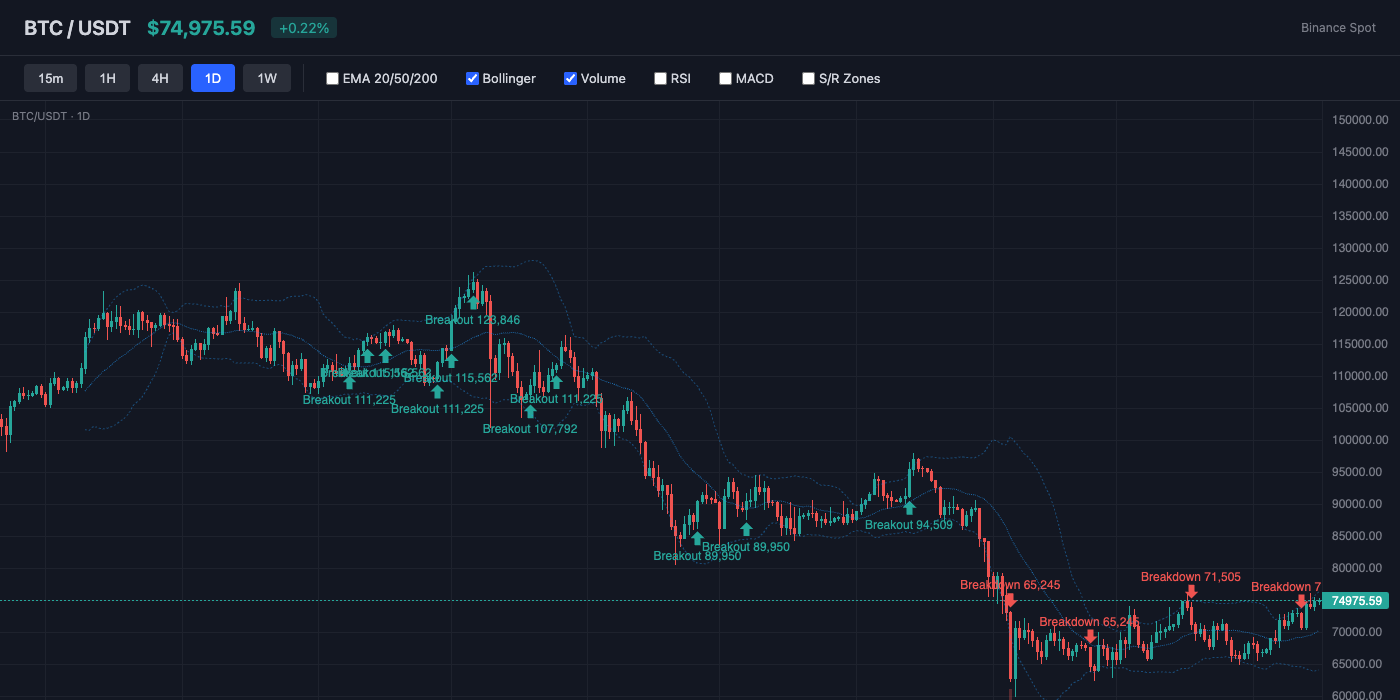
Bollinger Bands show a bandwidth of 16.6% (wide expansion — high volatility in play). Price sits near the upper band (%B: 93%), suggesting overbought conditions or strong bullish momentum. The middle band (SMA 20) at $69,948 acts as dynamic support.
Momentum Indicators
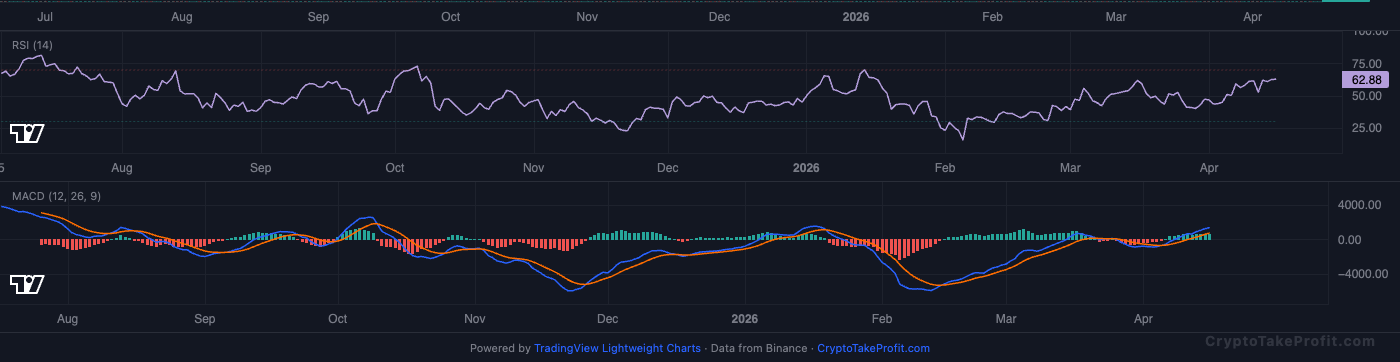
RSI reads 61.2, leaning bullish with room to run before reaching overbought. MACD has no active crossover, with positive histogram (665.93) indicating upward momentum.
Market Structure
Price at $74,966 sits above EMA20 $71,261 and EMA50 $71,151, according to current indicator feed, showing a short-term uptrend structure even while Signal 13 marks a conflicted neutral regime. RSI at 61.2 shows moderate bullish momentum but not overbought, while BB %B at 93.3% places price near the upper band $75,746, indicating stretched conditions as of this session (April 16, 2026). This combination creates compression near resistance $75,746 with support holding at $71,637 Pivot S1. Market cap at $2.62T (+1.7%, CoinMarketCap data) shows broader BTC-led expansion, but sentiment at Fear & Greed 23 signals heavy caution despite price strength.
Volume Analysis
Volume ratio at 0.66x average (per exchange aggregated volume data) shows weak participation behind the current push to $74,966. This means price is rising on reduced conviction rather than expansion, which limits trend durability in the short term. Open interest at 99,469 contracts with funding rate -0.0025% indicates slightly short-biased positioning, suggesting shorts are being pressured but not fully liquidated. Long/short ratio at 0.88 confirms market tilt toward shorts rather than leveraged longs.
Key Levels
| Price | Type | Source | Significance | Distance |
|---|---|---|---|---|
| $82,690 | Resistance | Pivot R3 | Low | +10.3% |
| $79,362 | Resistance | Pivot R2 | Medium | +5.9% |
| $77,164 | Resistance | Pivot R1 | Medium | +2.9% |
| $75,746 | Resistance | BB Upper | Low | +1.0% |
| $74,966 | Current | — | — | — |
| $71,637 | Support | Pivot S1 | Medium | -4.4% |
| $68,309 | Support | Pivot S2 | Medium | -8.9% |
| $66,111 | Support | Pivot S3 | Low | -11.8% |
| $64,973 | Support | Swing Low | High | -13.3% |
Moving Averages
| MA | Value | Position | Signal |
|---|---|---|---|
| EMA 20 | $71,261 | Above | Bullish |
| EMA 50 | $71,151 | Above | Bullish |
| EMA 200 | $85,414 | Below | Bearish |
| BB Middle (SMA 20) | $69,948 | Above | Bullish |
Trade Setup
BTC Scenario Analysis
Bullish Case
Trigger: N/A
Target: N/A
Invalidation: N/A
Base Case
Trigger: N/A
Target: N/A
Invalidation: N/A
Bearish Case
Trigger: N/A
Target: N/A
Invalidation: N/A
Bitcoin (BTC) Resources
Altcoin Overview
Among altcoins, ADA leads with the strongest bullish signal (score: 25), while AVAX shows the weakest setup (score: 10). Traders should focus on coins with clear directional signals and volume confirmation.
What to Watch
- BTC action around $74,966 for directional confirmation
- Fear & Greed at 23 for sentiment shift signals
- MACD crossover follow-through on top altcoins
- Volume confirmation on any support/resistance breaks
- BTC dominance at 57.2% for alt rotation signals


