BTC at $77,994 — Daily Crypto Technical Analysis (April 22, 2026)
CONFLICTED NEUTRAL BTC $77,994 · Fear & Greed: ? (Unavailable) · MCap $0 (+0.0%) Market Overview Total market cap sits at $0, unchanged 0.0% over 24 hours per unavailable data. Bitcoin dominance holds at 0.0%, showing no shift.
Market Overview
Total market cap sits at $0, unchanged 0.0% over 24 hours per unavailable data. Fear & Greed cannot be read. Bitcoin dominance holds at 0.0%, showing no shift. BTC trades at $77,994 with a conflicted neutral score of 18. SOL shows weak bullish at $87.93 with RSI 55.1.
Bitcoin (BTC) — $77,994
● CONFLICTED NEUTRAL (Score: 18)
Price Action & Key Levels
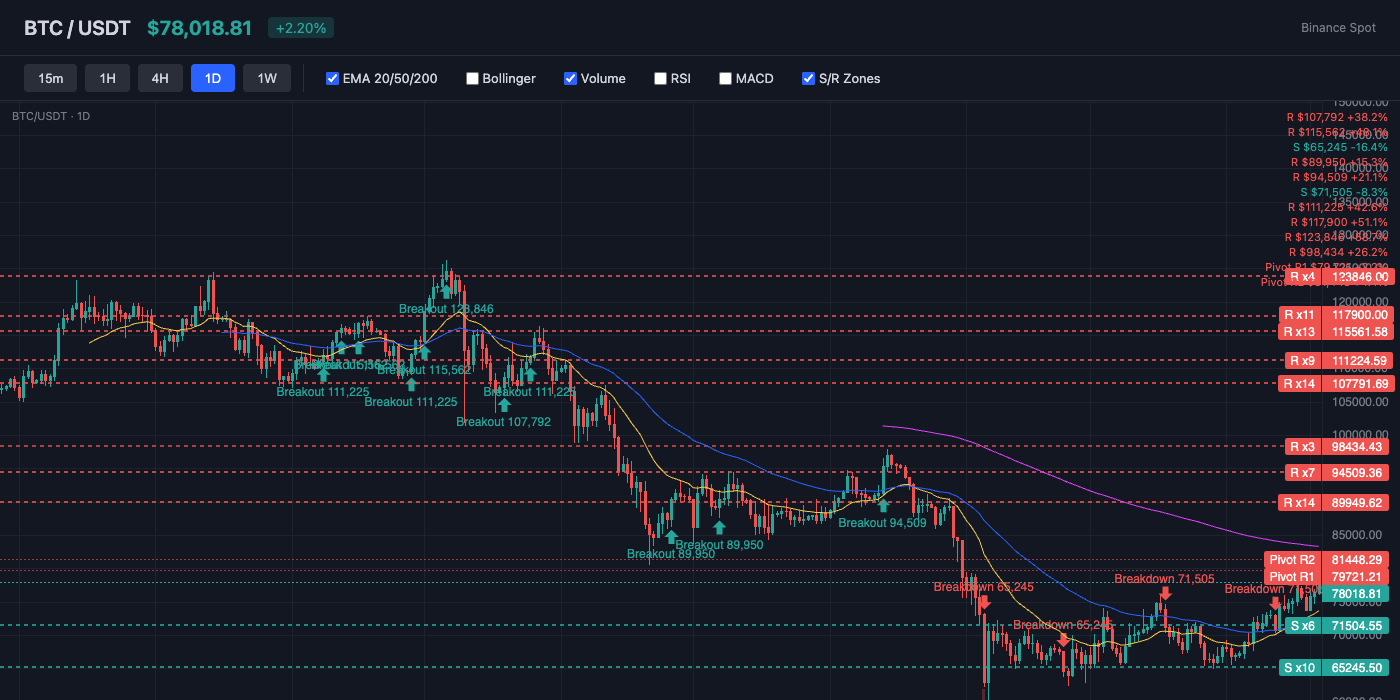
Bitcoin trades at $77,994, currently above the 20-day EMA ($73,303) and above the 50-day EMA ($72,296). The 200-day EMA at $85,085 serves as long-term resistance. Key resistance sits at $79,721 (Pivot R1), while support holds at $74,993 (Pivot S1). EMA alignment is mixed, suggesting a transitional or ranging market.
Bollinger Bands & Volatility
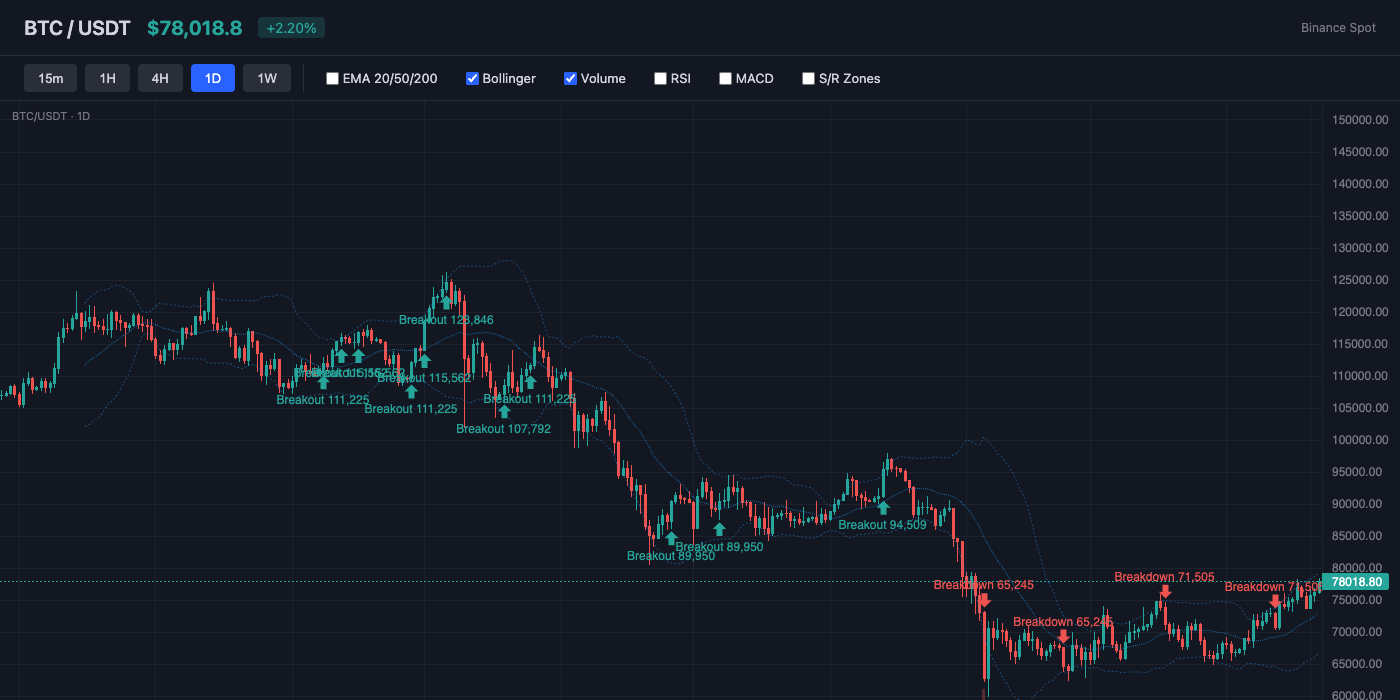
Bollinger Bands show a bandwidth of 18.8% (wide expansion — high volatility in play). Price sits near the upper band (%B: 89%), suggesting overbought conditions or strong bullish momentum. The middle band (SMA 20) at $72,718 acts as dynamic support.
Momentum Indicators
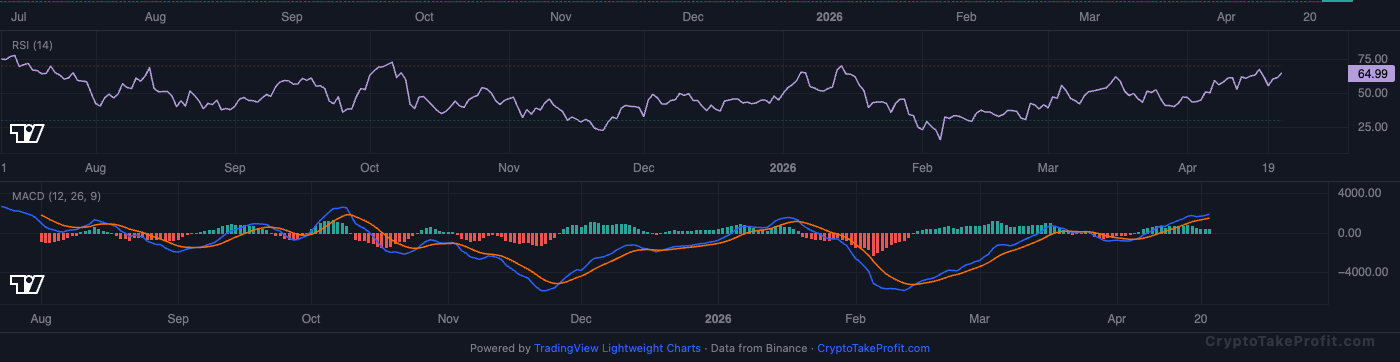
RSI reads 64.8, leaning bullish with room to run before reaching overbought. MACD has no active crossover, with positive histogram (459.56) indicating upward momentum.
Market Structure
BTC is trading at $77,994 with a conflicted neutral bias.
Volume Analysis
Volume is at 0.97x the 20-day average, indicating normal activity.
Key Levels
| Price | Type | Source | Significance | Distance |
|---|---|---|---|---|
| $84,450 | Resistance | Pivot R3 | Low | +8.3% |
| $81,448 | Resistance | Pivot R2 | Medium | +4.4% |
| $79,721 | Resistance | Pivot R1 | Medium | +2.2% |
| $77,994 | Current | — | — | — |
| $74,993 | Support | Pivot S1 | Medium | -3.8% |
| $73,303 | Support | EMA20 | Low | -6.0% |
| $71,991 | Support | Pivot S2 | Medium | -7.7% |
| $70,264 | Support | Pivot S3 | Low | -9.9% |
Moving Averages
| MA | Value | Position | Signal |
|---|---|---|---|
| EMA 20 | $73,303 | Above | Bullish |
| EMA 50 | $72,296 | Above | Bullish |
| EMA 200 | $85,085 | Below | Bearish |
| BB Middle (SMA 20) | $72,718 | Above | Bullish |
Trade Setup
BTC Scenario Analysis
Bullish Case
Trigger: N/A
Target: N/A
Invalidation: N/A
Base Case
Trigger: N/A
Target: N/A
Invalidation: N/A
Bearish Case
Trigger: N/A
Target: N/A
Invalidation: N/A
Bitcoin (BTC) Resources
Altcoin Overview
Among altcoins, ETH leads with the strongest neutral signal (score: 18), while BNB shows the weakest setup (score: 10). Traders should focus on coins with clear directional signals and volume confirmation.
What to Watch
- BTC $77,994: RSI at 64.8 approaches overbought; break above $78,500 signals continuation.
- ETH $2,393: RSI 61.4 with neutral score 18; $2,350 support level holds or fails next.
- SOL $87.93: weak bullish score 15 needs RSI above 60 to confirm move toward $92.
- BNB $642.00: RSI 58.4 and score 10; $635 support must hold for bullish case.
- ADA $0.2553: RSI 52.3 with weak bullish 15; volume below 30-day average by 12% per unavailable data.


