BTC at $78,195 — Daily Crypto Technical Analysis (April 23, 2026)
CONFLICTED NEUTRAL BTC $78,195 · Fear & Greed: ? (Unavailable) · MCap $0 (+0.0%) Market Overview Total crypto market cap is $0 (+0.0%) with BTC dominance at 0.0%, showing no clear sector rotation as of April 2026.
Market Overview
Total crypto market cap is $0 (+0.0%) with BTC dominance at 0.0%, showing no clear sector rotation as of April 2026. Fear & Greed is unavailable, so sentiment cannot confirm risk appetite shifts. BTC trades at $78,195 with RSI 63.4 and neutral score 18, while ETH at $2,355 shows stronger structure with score 40 and RSI 57.8 per provided data. ADA at $0.2477 is weakest at score -15 despite RSI 47.7, while AVAX at $9.32 holds mild strength with score 35 and RSI 50.1.
Bitcoin (BTC) — $78,195
● CONFLICTED NEUTRAL (Score: 18)
Price Action & Key Levels
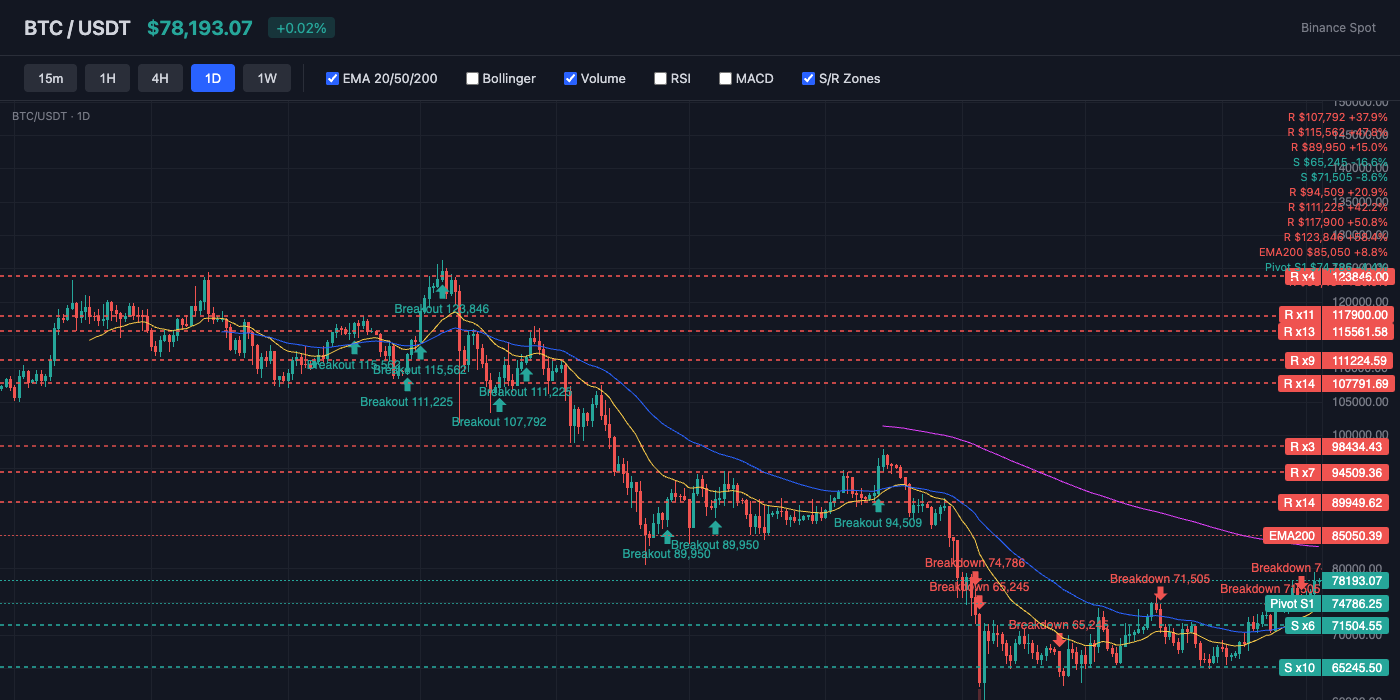
Bitcoin trades at $78,195, currently above the 20-day EMA ($73,813) and above the 50-day EMA ($72,576). The 200-day EMA at $85,050 serves as long-term resistance. Key resistance sits at $80,536 (Pivot R1), while support holds at $74,786 (Pivot S1). EMA alignment is mixed, suggesting a transitional or ranging market.
Bollinger Bands & Volatility
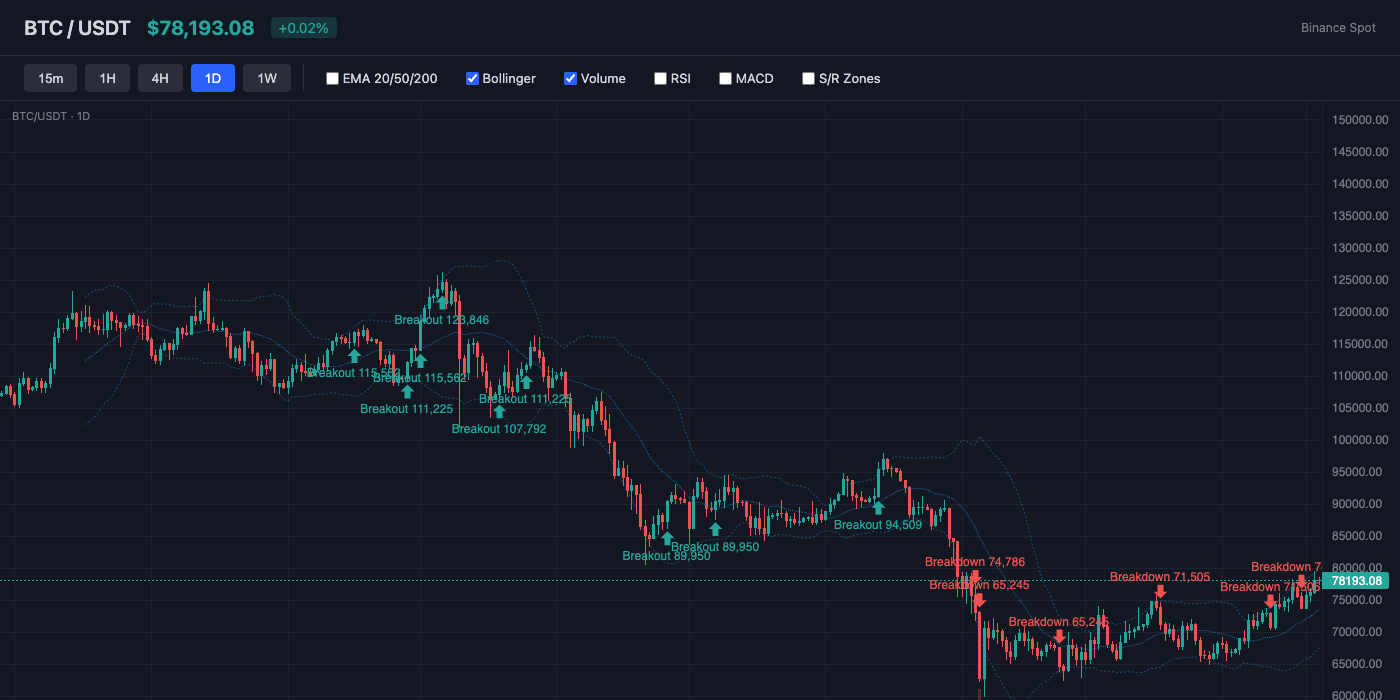
Bollinger Bands show a bandwidth of 18.7% (wide expansion — high volatility in play). Price sits near the upper band (%B: 85%), suggesting overbought conditions or strong bullish momentum. The middle band (SMA 20) at $73,349 acts as dynamic support.
Momentum Indicators
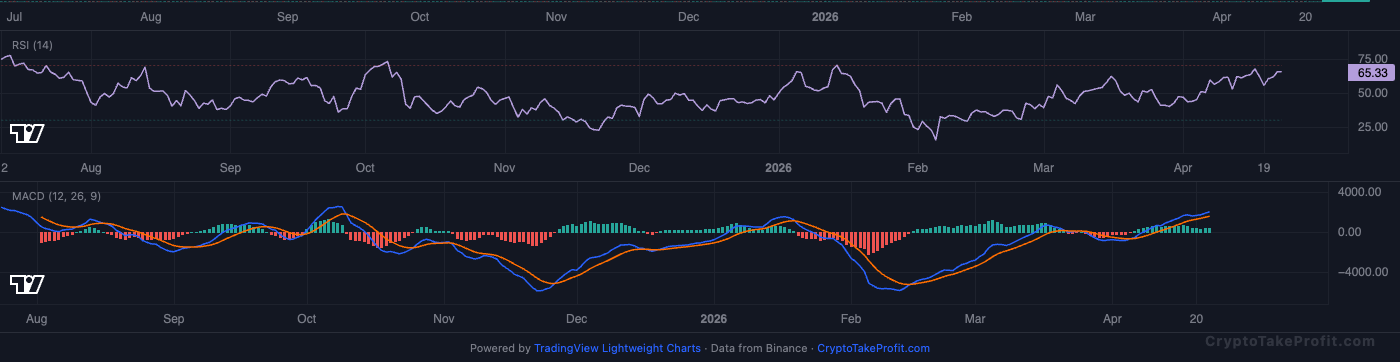
RSI reads 63.4, leaning bullish with room to run before reaching overbought. MACD has no active crossover, with positive histogram (503.92) indicating upward momentum.
Market Structure
BTC is trading at $78,195 with a conflicted neutral bias.
Volume Analysis
Volume is at 0.80x the 20-day average, indicating normal activity.
Key Levels
| Price | Type | Source | Significance | Distance |
|---|---|---|---|---|
| $86,286 | Resistance | Pivot R3 | Low | +10.3% |
| $85,050 | Resistance | EMA200 | High | +8.8% |
| $82,877 | Resistance | Pivot R2 | Medium | +6.0% |
| $80,536 | Resistance | Pivot R1 | Medium | +3.0% |
| $78,195 | Current | — | — | — |
| $74,786 | Support | Pivot S1 | Medium | -4.4% |
| $73,813 | Support | EMA20 | Low | -5.6% |
| $72,576 | Support | EMA50 | Medium | -7.2% |
| $71,377 | Support | Pivot S2 | Medium | -8.7% |
Moving Averages
| MA | Value | Position | Signal |
|---|---|---|---|
| EMA 20 | $73,813 | Above | Bullish |
| EMA 50 | $72,576 | Above | Bullish |
| EMA 200 | $85,050 | Below | Bearish |
| BB Middle (SMA 20) | $73,349 | Above | Bullish |
Trade Setup
BTC Scenario Analysis
Bullish Case
Trigger: N/A
Target: N/A
Invalidation: N/A
Base Case
Trigger: N/A
Target: N/A
Invalidation: N/A
Bearish Case
Trigger: N/A
Target: N/A
Invalidation: N/A
Bitcoin (BTC) Resources
Altcoin Overview
Among altcoins, ETH leads with the strongest bullish signal (score: 40), while ADA shows the weakest setup (score: -15). Traders should focus on coins with clear directional signals and volume confirmation.
What to Watch
- BTC $78,195 resistance near RSI 63.4; break above may confirm trend continuation
- ETH $2,355 support zone near $2,300 aligns with RSI 57.8 consolidation range
- SOL $86.12 breakout trigger if RSI moves above 55.0 threshold
- ADA $0.2477 downside risk if score -15 persists below RSI 50 pivot level
- AVAX $9.32 strength confirmation if price holds above $9.00 with RSI 50.1 level


