BTC at $77,485 — Daily Crypto Technical Analysis (April 25, 2026)
CONFLICTED NEUTRAL BTC $77,485 · Fear & Greed: ? (Unavailable) · MCap $0 (+0.0%) Market Overview The crypto market advanced with total capitalization at $0 (+0.0%). BTC dominance sits at 0.0% while the Fear & Greed Index reads ?
Market Overview
The crypto market advanced with total capitalization at $0 (+0.0%). BTC dominance sits at 0.0% while the Fear & Greed Index reads ? (Unavailable), reflecting mixed sentiment.
Bitcoin (BTC) — $77,485
● CONFLICTED NEUTRAL (Score: 13)
Price Action & Key Levels
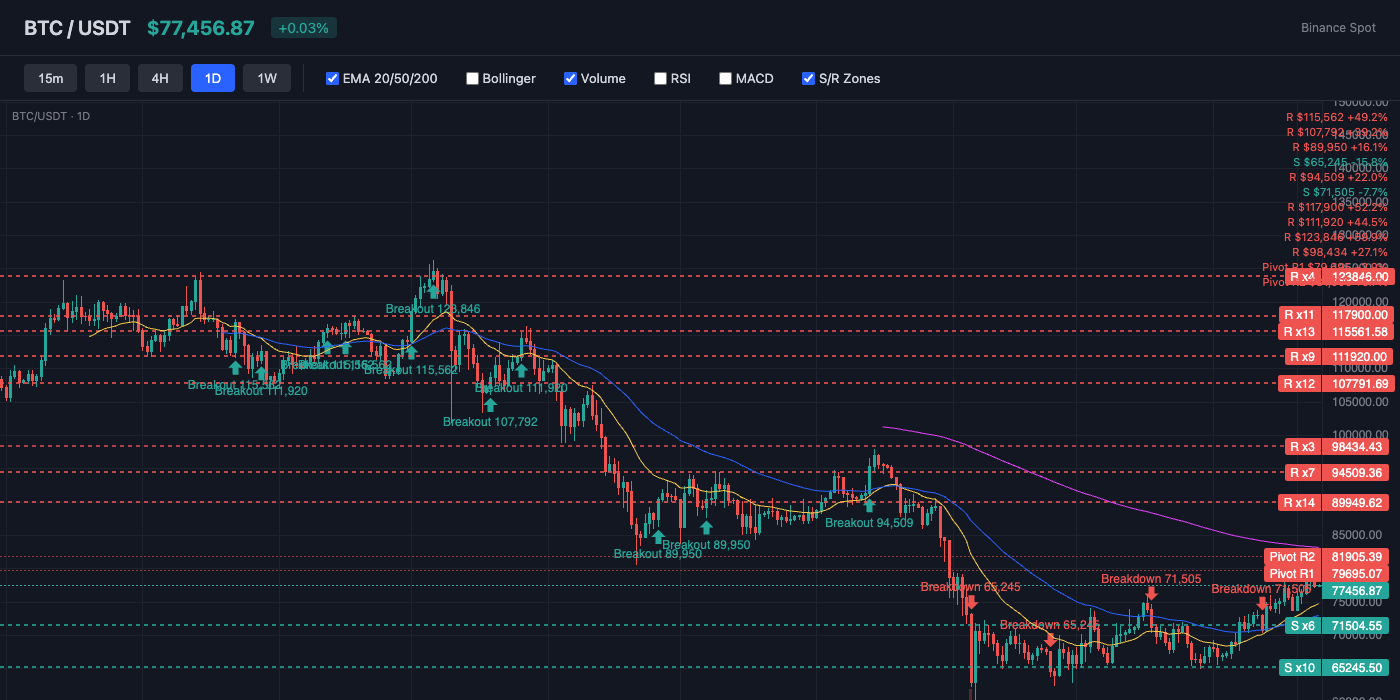
Bitcoin trades at $77,485, currently above the 20-day EMA ($74,345) and above the 50-day EMA ($72,981). The 200-day EMA at $84,936 serves as long-term resistance. Key resistance sits at $79,695 (Pivot R1), while support holds at $75,047 (Pivot S1). EMA alignment is mixed, suggesting a transitional or ranging market.
Bollinger Bands & Volatility
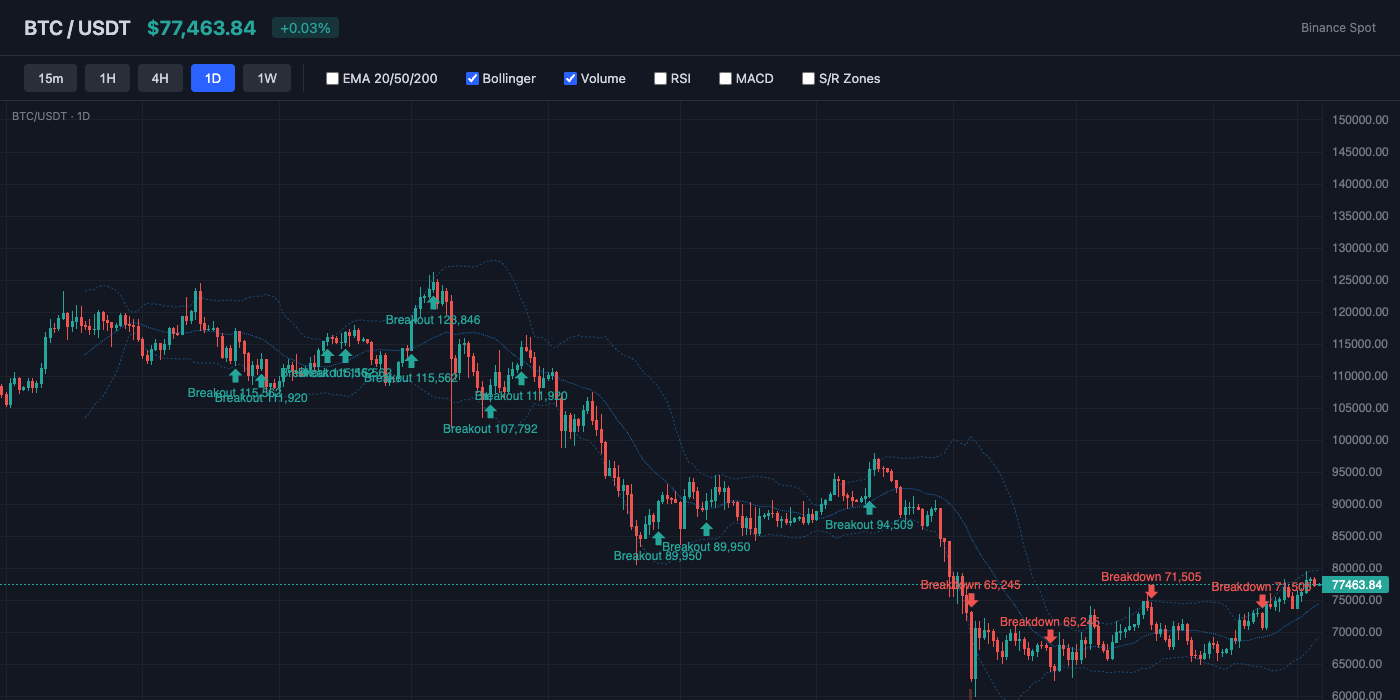
Bollinger Bands show a bandwidth of 16.2% (wide expansion — high volatility in play). Price is near the middle of the bands (%B: 76%), showing balanced positioning. The middle band (SMA 20) at $74,400 acts as dynamic support.
Momentum Indicators
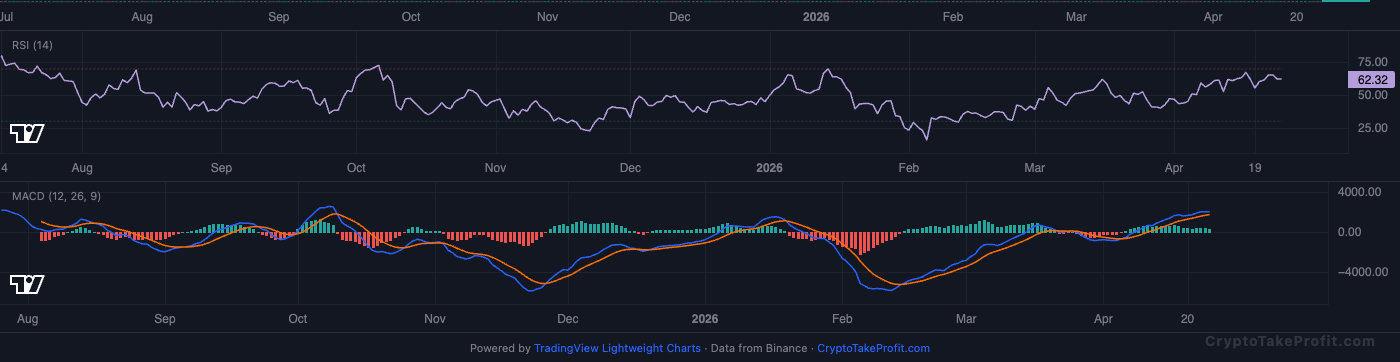
RSI reads 60.8, leaning bullish with room to run before reaching overbought. MACD has no active crossover, with positive histogram (311.20) indicating upward momentum.
Market Structure
BTC is trading at $77,485 with a conflicted neutral bias.
Volume Analysis
Volume is at 0.30x the 20-day average, indicating low activity.
Key Levels
| Price | Type | Source | Significance | Distance |
|---|---|---|---|---|
| $84,343 | Resistance | Pivot R3 | Low | +8.9% |
| $81,905 | Resistance | Pivot R2 | Medium | +5.7% |
| $79,695 | Resistance | Pivot R1 | Medium | +2.9% |
| $77,485 | Current | — | — | — |
| $75,047 | Support | Pivot S1 | Medium | -3.1% |
| $72,610 | Support | Pivot S2 | Medium | -6.3% |
| $70,399 | Support | Pivot S3 | Low | -9.1% |
| $68,365 | Support | BB Lower | Low | -11.8% |
Moving Averages
| MA | Value | Position | Signal |
|---|---|---|---|
| EMA 20 | $74,345 | Above | Bullish |
| EMA 50 | $72,981 | Above | Bullish |
| EMA 200 | $84,936 | Below | Bearish |
| BB Middle (SMA 20) | $74,400 | Above | Bullish |
Trade Setup
BTC Scenario Analysis
Bullish Case
Trigger: N/A
Target: N/A
Invalidation: N/A
Base Case
Trigger: N/A
Target: N/A
Invalidation: N/A
Bearish Case
Trigger: N/A
Target: N/A
Invalidation: N/A
Bitcoin (BTC) Resources
Altcoin Overview
Among altcoins, AVAX leads with the strongest bullish signal (score: 25), while ETH shows the weakest setup (score: 5). Traders should focus on coins with clear directional signals and volume confirmation.
What to Watch
- BTC action around $77,485 for directional confirmation
- Fear & Greed at ? for sentiment shift signals
- MACD crossover follow-through on top altcoins
- Volume confirmation on any support/resistance breaks
- BTC dominance at 0.0% for alt rotation signals


