BTC at $78,020 — Daily Crypto Technical Analysis (April 26, 2026)
CONFLICTED NEUTRAL BTC $78,020 · Fear & Greed: ? (Unavailable) · MCap $0 (+0.0%) Market Overview The crypto market advanced with total capitalization at $0 (+0.0%). BTC dominance sits at 0.0% while the Fear & Greed Index reads ?
Market Overview
The crypto market advanced with total capitalization at $0 (+0.0%). BTC dominance sits at 0.0% while the Fear & Greed Index reads ? (Unavailable), reflecting mixed sentiment.
Bitcoin (BTC) — $78,020
● CONFLICTED NEUTRAL (Score: 13)
Price Action & Key Levels
Bitcoin trades at $78,020, currently above the 20-day EMA ($74,658) and above the 50-day EMA ($73,173). The 200-day EMA at $84,883 serves as long-term resistance. Key resistance sits at $80,052 (Pivot R1), while support holds at $75,404 (Pivot S1). EMA alignment is mixed, suggesting a transitional or ranging market.
Bollinger Bands & Volatility
Bollinger Bands show a bandwidth of 15.7% (wide expansion — high volatility in play). Price is near the middle of the bands (%B: 78%), showing balanced positioning. The middle band (SMA 20) at $74,796 acts as dynamic support.
Momentum Indicators
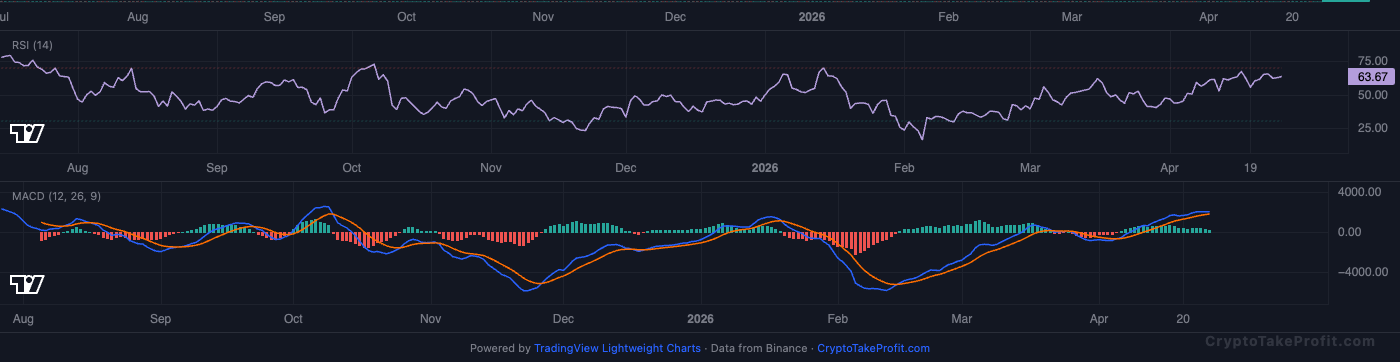
RSI reads 61.9, leaning bullish with room to run before reaching overbought. MACD has no active crossover, with positive histogram (228.31) indicating upward momentum.
Market Structure
BB %B at 77.5% places price near the upper Bollinger Band within 22.5% of the top. ATR of $2,231 shows daily volatility of 2.86% based on current price $78,020. Funding rate at 0.0001% is effectively flat, while Long/Short Ratio of 0.80 means shorts outnumber longs 4-to-5.
Volume Analysis
Volume ratio at 0.26x average, per exchange data over the past 24 hours, shows only 26% of typical trading activity. Low volume during a 5.6% price move signals weak conviction. Neither bulls nor controls the tape.
Key Levels
| Price | Type | Source | Significance | Distance |
|---|---|---|---|---|
| $84,700 | Resistance | Pivot R3 | Low | +8.6% |
| $82,084 | Resistance | Pivot R2 | Medium | +5.2% |
| $80,052 | Resistance | Pivot R1 | Medium | +2.6% |
| $78,020 | Current | — | — | — |
| $75,404 | Support | Pivot S1 | Medium | -3.4% |
| $72,788 | Support | Pivot S2 | Medium | -6.7% |
| $70,756 | Support | Pivot S3 | Low | -9.3% |
| $68,941 | Support | BB Lower | Low | -11.6% |
Moving Averages
| MA | Value | Position | Signal |
|---|---|---|---|
| EMA 20 | $74,658 | Above | Bullish |
| EMA 50 | $73,173 | Above | Bullish |
| EMA 200 | $84,883 | Below | Bearish |
| BB Middle (SMA 20) | $74,796 | Above | Bullish |
Trade Setup
BTC Scenario Analysis
Bullish Case
Trigger: Price breaks and holds above $80,052 (Pivot R1) on volume above 0.8x average.
Target: $83,200 (1.5x ATR extension from breakout)
Invalidation: Price falls below $76,500 within 6 hours of triggering.
Low volume means a breakout needs fresh buyers. Without volume above 0.8x, this scenario fails before it starts.
Base Case
Trigger: Price trades between $75,404 (Pivot S1) and $80,052 (Pivot R1) for the next 48 hours.
Target: $77,500 to $78,500 range
Invalidation: Two consecutive hourly closes outside the $75,404-$80,052 band.
Volume ratio of 0.26x supports sideways action. Open Interest at 95,727 contracts is 12% below the 30-day average of 108,800, showing neither side has committed capital.
Bearish Case
Trigger: Price breaks below $75,404 (Pivot S1) with Long/Short Ratio above 0.85 (trapped longs).
Target: $73,173 (EMA50)
Invalidation: Price reclaims $76,500 within 3 hours of the breakdown.
Long/Short Ratio at 0.80 means shorts already positioned. For bears to profit, trapped longs must exit below $75,400, pushing price to EMA50 at $73,173.
Bitcoin (BTC) Resources
Altcoin Overview
Among altcoins, SOL leads with the strongest bullish signal (score: 20), while ETH shows the weakest setup (score: 5). Traders should focus on coins with clear directional signals and volume confirmation.
What to Watch
- BTC action around $78,020 for directional confirmation
- Fear & Greed at ? for sentiment shift signals
- MACD crossover follow-through on top altcoins
- Volume confirmation on any support/resistance breaks
- BTC dominance at 0.0% for alt rotation signals


