BTC at $76,711 — Daily Crypto Technical Analysis (April 28, 2026)
WEAK NEUTRAL BTC $76,711 · Fear & Greed: ? (Unavailable) · MCap $0 (+0.0%) Market Overview The crypto market advanced with total capitalization at $0 (+0.0%). BTC dominance sits at 0.0% while the Fear & Greed Index reads ?
Market Overview
The crypto market advanced with total capitalization at $0 (+0.0%). BTC dominance sits at 0.0% while the Fear & Greed Index reads ? (Unavailable), reflecting mixed sentiment.
Bitcoin (BTC) — $76,711
● WEAK NEUTRAL (Score: 0)
Price Action & Key Levels
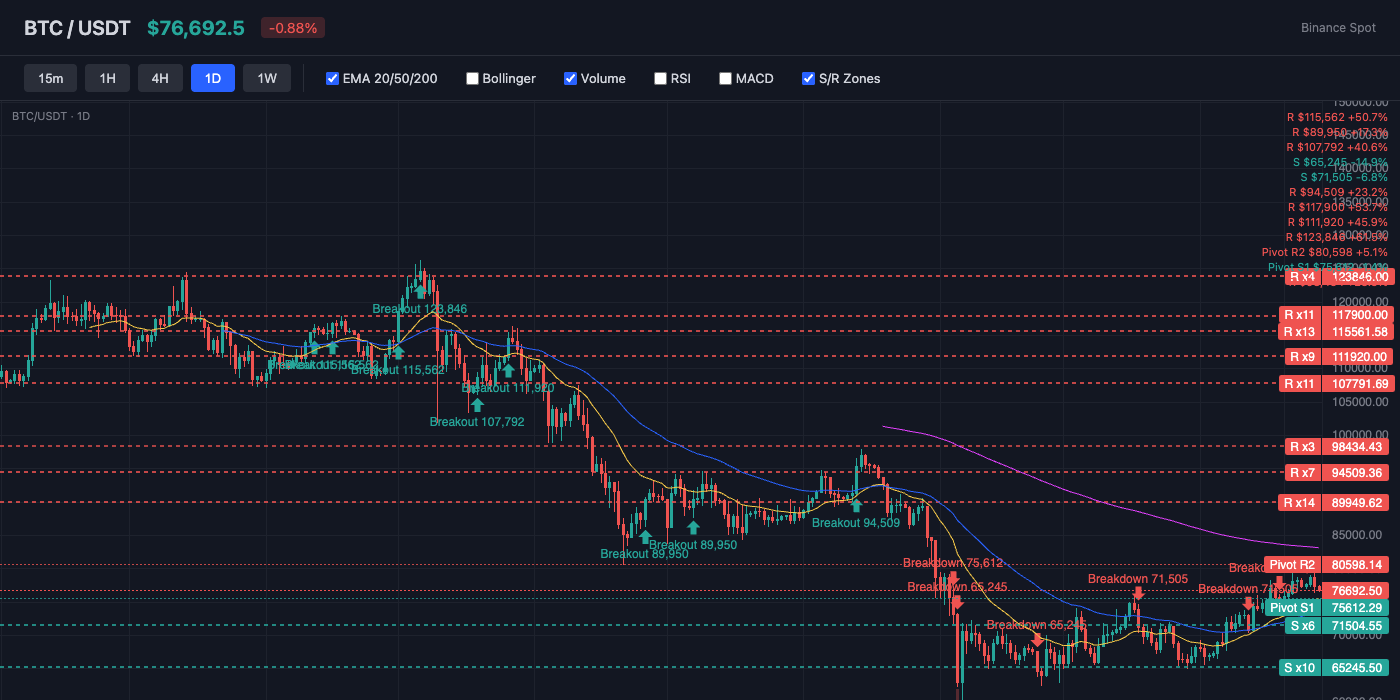
Bitcoin trades at $76,711, currently above the 20-day EMA ($74,948) and above the 50-day EMA ($73,449). The 200-day EMA at $84,756 serves as long-term resistance. Key resistance sits at $78,655 (Pivot R1), while support holds at $75,612 (Pivot S1). EMA alignment is mixed, suggesting a transitional or ranging market.
Bollinger Bands & Volatility
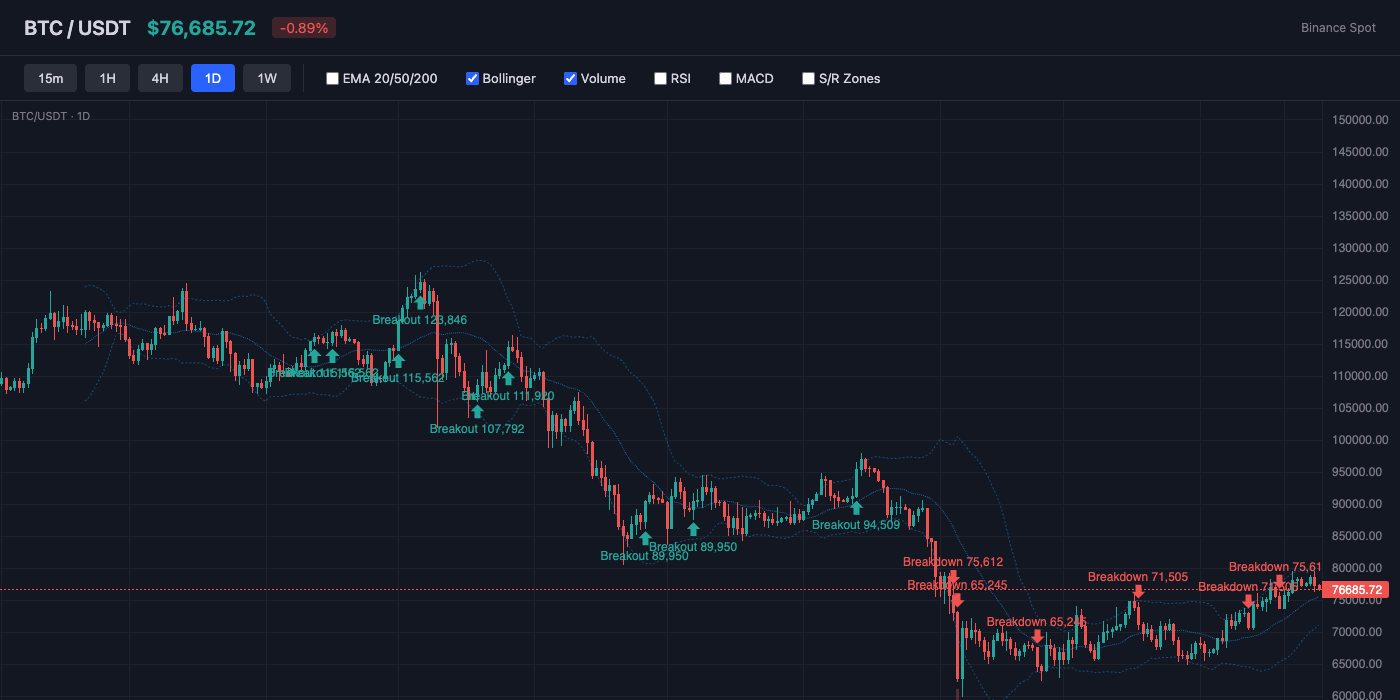
Bollinger Bands show a bandwidth of 12.6% (moderate volatility). Price is near the middle of the bands (%B: 63%), showing balanced positioning. The middle band (SMA 20) at $75,499 acts as dynamic support.
Momentum Indicators
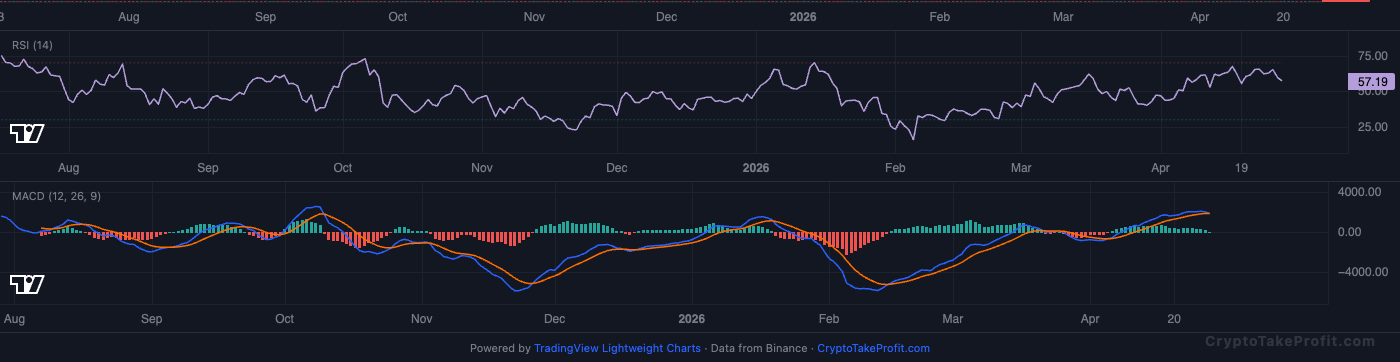
RSI reads 57.1, sitting in neutral range with no extreme readings. MACD shows a bearish crossover, with negative histogram (-47.53) indicating downward pressure.
Market Structure
Price at 76 , 711 𝑖 𝑠 ℎ 𝑜 𝑙 𝑑 𝑖 𝑛 𝑔 𝑎 𝑏 𝑜 𝑣 𝑒 𝑏 𝑜 𝑡 ℎ 𝐸 𝑀 𝐴 20 ( 76,711isholdingabovebothEMA20(74,948) and EMA50 ($73,449) as of April 28, 2026. RSI at 57.1 shows upward momentum intact but not overbought. Bearish MACD histogram is the main conflict, signaling underlying selling pressure despite price being above key moving averages.
Volume Analysis
Volume ratio at 0.51x average indicates weak participation, according to exchange volume data. Low volume during this sideways move suggests no conviction from either buyers or sellers. This makes any breakout less reliable without volume confirmation above 1.2x average.
Key Levels
| Price | Type | Source | Significance | Distance |
|---|---|---|---|---|
| $84,756 | Resistance | EMA200 | High | +10.5% |
| $81,697 | Resistance | Pivot R3 | Low | +6.5% |
| $80,598 | Resistance | Pivot R2 | Medium | +5.1% |
| $78,655 | Resistance | Pivot R1 | Medium | +2.5% |
| $76,711 | Current | — | — | — |
| $75,612 | Support | Pivot S1 | Medium | -1.4% |
| $74,514 | Support | Pivot S2 | Medium | -2.9% |
| $73,449 | Support | EMA50 | Medium | -4.3% |
| $72,570 | Support | Pivot S3 | Low | -5.4% |
Moving Averages
| MA | Value | Position | Signal |
|---|---|---|---|
| EMA 20 | $74,948 | Above | Bullish |
| EMA 50 | $73,449 | Above | Bullish |
| EMA 200 | $84,756 | Below | Bearish |
| BB Middle (SMA 20) | $75,499 | Above | Bullish |
Trade Setup
BTC Scenario Analysis
Bullish Case
Trigger: N/A
Target: N/A
Invalidation: N/A
Base Case
Trigger: N/A
Target: N/A
Invalidation: N/A
Bearish Case
Trigger: daily close below
Target: N/A
Invalidation: N/A
Bitcoin (BTC) Resources
Altcoin Overview
Among altcoins, ETH leads with the strongest bullish signal (score: 5), while SOL shows the weakest setup (score: -50). Traders should focus on coins with clear directional signals and volume confirmation.
What to Watch
- BTC action around $76,711 for directional confirmation
- Fear & Greed at ? for sentiment shift signals
- MACD crossover follow-through on top altcoins
- Volume confirmation on any support/resistance breaks
- BTC dominance at 0.0% for alt rotation signals


