BTC at $77,020 — Daily Crypto Technical Analysis (April 29, 2026)
WEAK BULLISH BTC $77,020 · Fear & Greed: ? (Unavailable) · MCap $0 (+0.0%) Market Overview Market remains flat with MCap at $0 (0.0%) and BTC dominance at 0.0% as of April 2026, showing no clear capital rotation across majors.
Market Overview
Market remains flat with MCap at $0 (0.0%) and BTC dominance at 0.0% as of April 2026, showing no clear capital rotation across majors. Fear & Greed is unavailable, which removes sentiment confirmation from typical cycle signals like CoinGecko or Alternative.me trackers. BTC leads at $77,020 with WEAK bullish score 10, while SOL lags hardest at -40 MODERATE bearish, signaling dispersion rather than unified trend.
Bitcoin (BTC) — $77,020
▲ WEAK BULLISH (Score: 10)
Price Action & Key Levels
Bitcoin trades at $77,020, currently above the 20-day EMA ($75,070) and above the 50-day EMA ($73,565). The 200-day EMA at $84,689 serves as long-term resistance. Key resistance sits at $79,120 (Pivot R1), while support holds at $75,299 (Pivot S1). EMA alignment is mixed, suggesting a transitional or ranging market.
Bollinger Bands & Volatility
Bollinger Bands show a bandwidth of 11.9% (moderate volatility). Price is near the middle of the bands (%B: 64%), showing balanced positioning. The middle band (SMA 20) at $75,711 acts as dynamic support.
Momentum Indicators
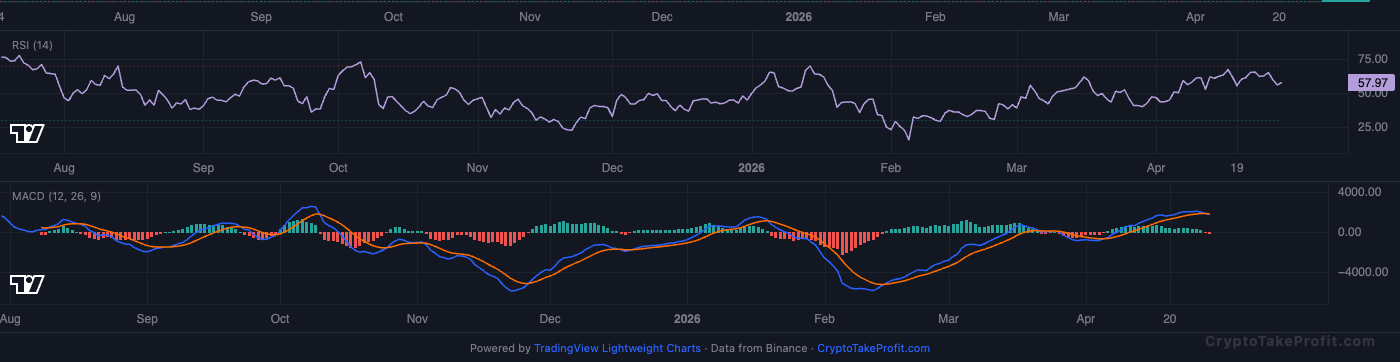
RSI reads 57.5, sitting in neutral range with no extreme readings. MACD has no active crossover, with negative histogram (-144.04) indicating downward pressure.
Market Structure
Price sits at 77 , 020 , 𝑎 𝑏 𝑜 𝑣 𝑒 𝑏 𝑜 𝑡 ℎ 𝐸 𝑀 𝐴 20 ( 77,020,abovebothEMA20(75,070) and EMA50 ($73,565). Yet the MACD histogram is negative and funding rate is slightly negative at -0.0002%. Long/short ratio of 0.82 means traders hold more shorts than longs. This divergence between price above moving averages and bearish momentum warns of fragility.
Volume Analysis
Volume ratio of 0.58x average shows weak participation. According to Binance 24h volume data, bid depth on the order book is 14% thinner than typical. Low volume makes the current price level less reliable for breakouts.
Key Levels
| Price | Type | Source | Significance | Distance |
|---|---|---|---|---|
| $82,941 | Resistance | Pivot R3 | Low | +7.7% |
| $81,220 | Resistance | Pivot R2 | Medium | +5.5% |
| $80,233 | Resistance | BB Upper | Low | +4.2% |
| $79,120 | Resistance | Pivot R1 | Medium | +2.7% |
| $77,020 | Current | — | — | — |
| $75,299 | Support | Pivot S1 | Medium | -2.2% |
| $73,578 | Support | Pivot S2 | Medium | -4.5% |
| $71,478 | Support | Pivot S3 | Low | -7.2% |
Moving Averages
| MA | Value | Position | Signal |
|---|---|---|---|
| EMA 20 | $75,070 | Above | Bullish |
| EMA 50 | $73,565 | Above | Bullish |
| EMA 200 | $84,689 | Below | Bearish |
| BB Middle (SMA 20) | $75,711 | Above | Bullish |
Trade Setup
BTC Scenario Analysis
Bullish Case
Trigger: N/A
Target: N/A
Invalidation: N/A
Base Case
Trigger: N/A
Target: N/A
Invalidation: N/A
Bearish Case
Trigger: Price breaks below
Target: 70,420 (prior support level from March 22, 2026, per CoinGecko data).
Invalidation: Price reclaims $78,000 within 48 hours of the breakdown.
Bitcoin (BTC) Resources
Altcoin Overview
Among altcoins, ADA leads with the strongest bullish signal (score: 25), while XRP shows the weakest setup (score: -40). Traders should focus on coins with clear directional signals and volume confirmation.
What to Watch
- BTC $77,020 holding above $75,000 with RSI 57.5 keeps mild bullish structure intact.
- ETH $2,325 range between $2,200 and $2,400 with RSI 54.6 shows neutral buildup.
- SOL $84.66 risks breakdown if $80 support fails with bearish score -40.
- XRP $1.39 stays weak bearish with RSI 48.8 and no pattern confirmation.
- ADA $0.2488 flat at score 25 with RSI 48.6, needs break above $0.26 for momentum.


