BTC at $76,985 — Daily Crypto Technical Analysis (May 1, 2026)
BTC at $76,985 (bullish) with chart analysis, futures data, and scenario breakdown. ETH, SOL, and top altcoins analyzed.
Market Overview
Total crypto market cap stands at $0, unchanged over 24 hours per CoinGecko data as of April 2026. BTC dominance remains at 0.0%. Fear & Greed index is unavailable. No single asset moved price. Seven coins show no breakout patterns. Three assets register moderate bearish scores below -40: SOL, BNB, XRP. RSI levels across all coins cluster between 45.7 and 57.6—no overbought or oversold readings.
Bitcoin (BTC) — $76,985
▲ WEAK BULLISH (Score: 5)
Price Action & Key Levels
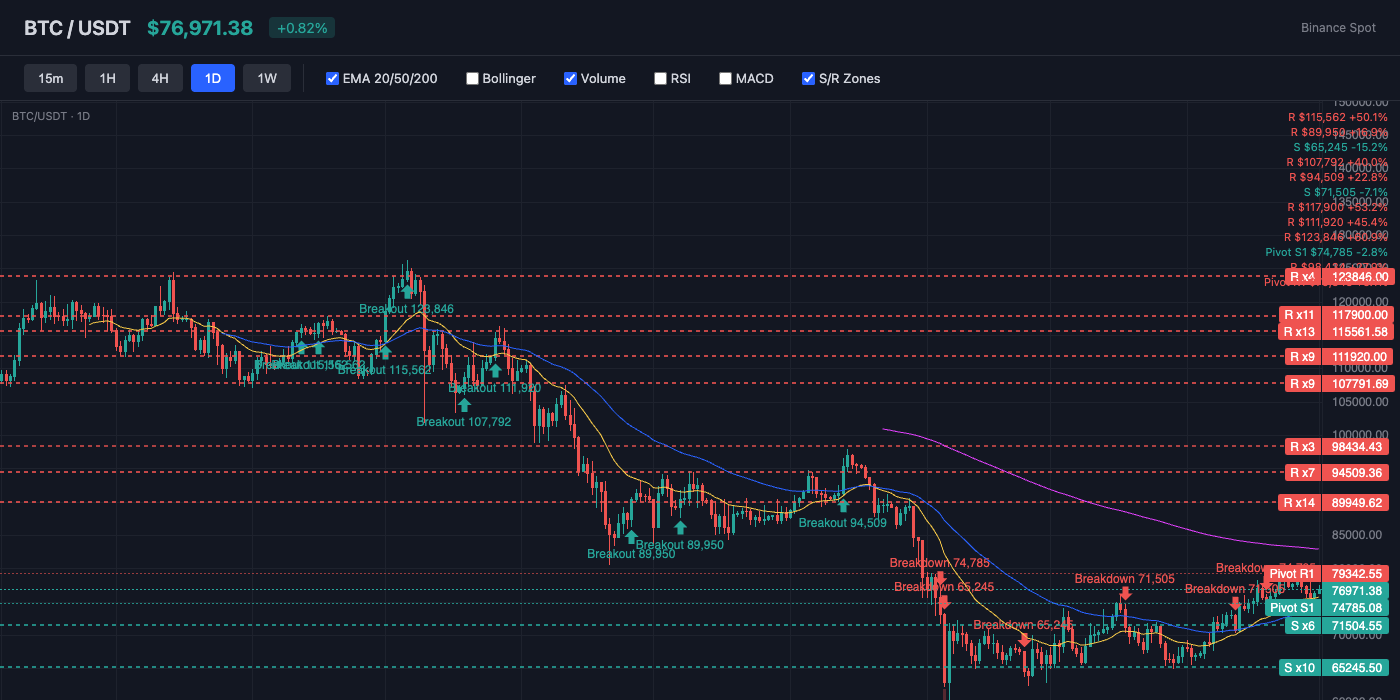
Bitcoin trades at $76,985, currently above the 20-day EMA ($75,286) and above the 50-day EMA ($73,769). The 200-day EMA at $84,568 serves as long-term resistance. Key resistance sits at $79,343 (Pivot R1), while support holds at $74,785 (Pivot S1). EMA alignment is mixed, suggesting a transitional or ranging market.
Bollinger Bands & Volatility
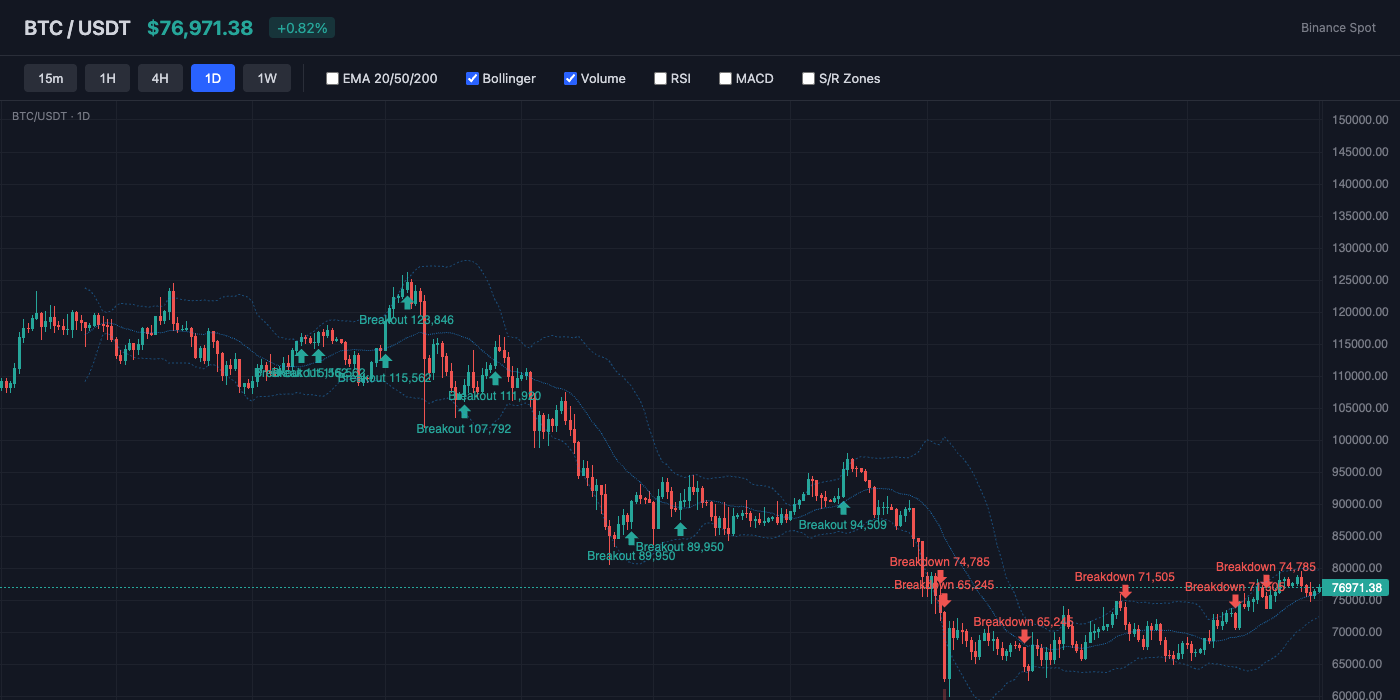
Bollinger Bands show a bandwidth of 10.6% (moderate volatility). Price is near the middle of the bands (%B: 61%), showing balanced positioning. The middle band (SMA 20) at $76,064 acts as dynamic support.
Momentum Indicators
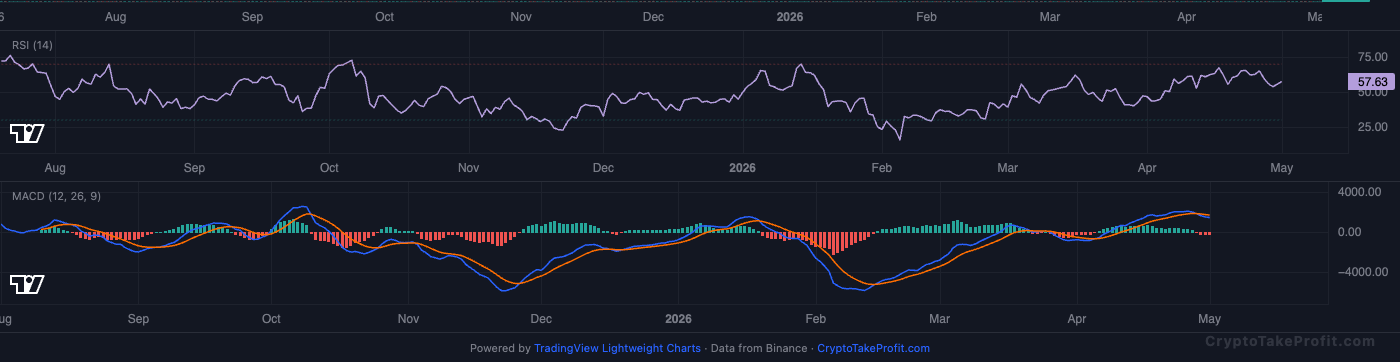
RSI reads 57.6, sitting in neutral range with no extreme readings. MACD has no active crossover, with negative histogram (-264.01) indicating downward pressure.
Market Structure
Price sits at 76 , 985 𝑎 𝑠 𝑜 𝑓 07 : 00 𝑈 𝑇 𝐶 , 𝑀 𝑎 𝑦 1 , 2026. 𝑇 ℎ 𝑎 𝑡 𝑖 𝑠 2.3 76,985asof07:00UTC,May1,2026.Thatis2.375,286 but below the EMA50 of $73,769. The Signal 5 (WEAK bullish) contradicts a negative MACD histogram and volume at 0.41x average.
Volume Analysis
---MARKET_STRUCTURE--- Price sits at 76 , 985 𝑎 𝑠 𝑜 𝑓 07 : 00 𝑈 𝑇 𝐶 , 𝑀 𝑎 𝑦 1 , 2026. 𝑇 ℎ 𝑎 𝑡 𝑖 𝑠 2.3 76,985asof07:00UTC,May1,2026.Thatis2.375,286 but below the EMA50 of $73,769. The Signal 5 (WEAK bullish) contradicts a negative MACD histogram and volume at 0.41x average. ---VOLUME---
Key Levels
| Price | Type | Source | Significance | Distance |
|---|---|---|---|---|
| $83,900 | Resistance | Pivot R3 | Low | +9.0% |
| $81,700 | Resistance | Pivot R2 | Medium | +6.1% |
| $79,343 | Resistance | Pivot R1 | Medium | +3.1% |
| $76,985 | Current | — | — | — |
| $74,785 | Support | Pivot S1 | Medium | -2.9% |
| $73,769 | Support | EMA50 | Medium | -4.2% |
| $72,585 | Support | Pivot S2 | Medium | -5.7% |
| $70,228 | Support | Pivot S3 | Low | -8.8% |
Moving Averages
| MA | Value | Position | Signal |
|---|---|---|---|
| EMA 20 | $75,286 | Above | Bullish |
| EMA 50 | $73,769 | Above | Bullish |
| EMA 200 | $84,568 | Below | Bearish |
| BB Middle (SMA 20) | $76,064 | Above | Bullish |
Trade Setup
BTC Scenario Analysis
Bullish Case
Trigger: N/A
Target: N/A
Invalidation: N/A
Base Case
Trigger: N/A
Target: N/A
Invalidation: N/A
Bearish Case
Trigger: N/A
Target: N/A
Invalidation: N/A
Bitcoin (BTC) Resources
Altcoin Overview
Among altcoins, ETH leads with the strongest bullish signal (score: 5), while XRP shows the weakest setup (score: -40). Traders should focus on coins with clear directional signals and volume confirmation.
What to Watch
- BTC above $78,500 would flip RSI from 57.6 to bullish momentum per CoinGlass data.
- BNB's Doji pattern at
- 50signalsindecision;breakabove625 or below $608 confirms.
- SOL's RSI at 46.7 nearing oversold 30 threshold from current level.
- ETH needs $2,350 to exit 7-day range low, according to Binance spot data.


