BTC at $78,348 — Daily Crypto Technical Analysis (May 2, 2026)
BTC at $78,348 (bearish) with chart analysis, futures data, and scenario breakdown. ETH, SOL, and top altcoins analyzed.
Market Overview
Crypto market shows mixed weakness as BTC trades at $78,348 with RSI 61.1, while ETH sits at $2,305 with RSI 53.4, both holding above neutral momentum. SOL leads downside pressure at $83.83 with a MODERATE bearish score of -40 and RSI 46.8, while Fear & Greed is unavailable and BTC dominance reads 0.0%, limiting macro sentiment signals. Since Q2 2026, price action suggests rotation risk rather than trend expansion, with altcoins lagging BTC strength.
Bitcoin (BTC) — $78,348
▼ WEAK BEARISH (Score: -7)
Price Action & Key Levels
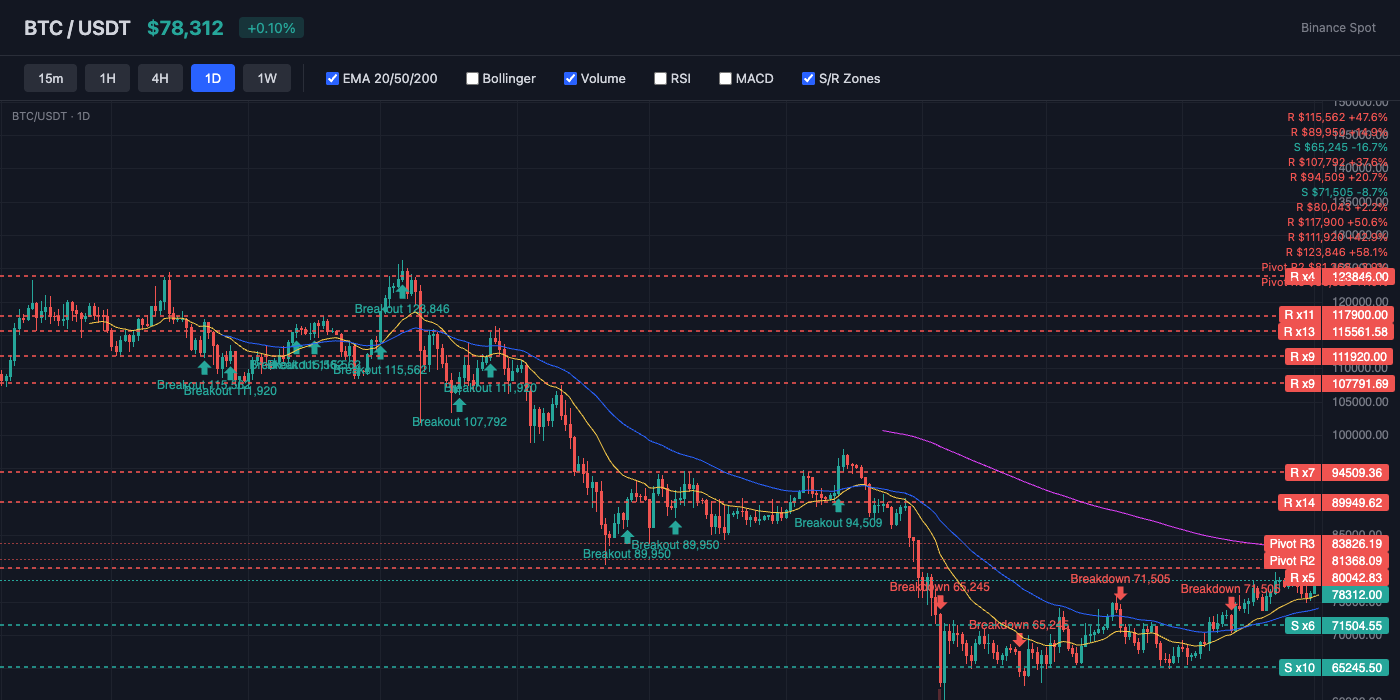
Bitcoin trades at $78,348, currently above the 20-day EMA ($75,682) and above the 50-day EMA ($74,003). The 200-day EMA at $84,545 serves as long-term resistance. Key resistance sits at $79,858 (Pivot R1), while support holds at $75,890 (Pivot S1). EMA alignment is mixed, suggesting a transitional or ranging market.
Bollinger Bands & Volatility
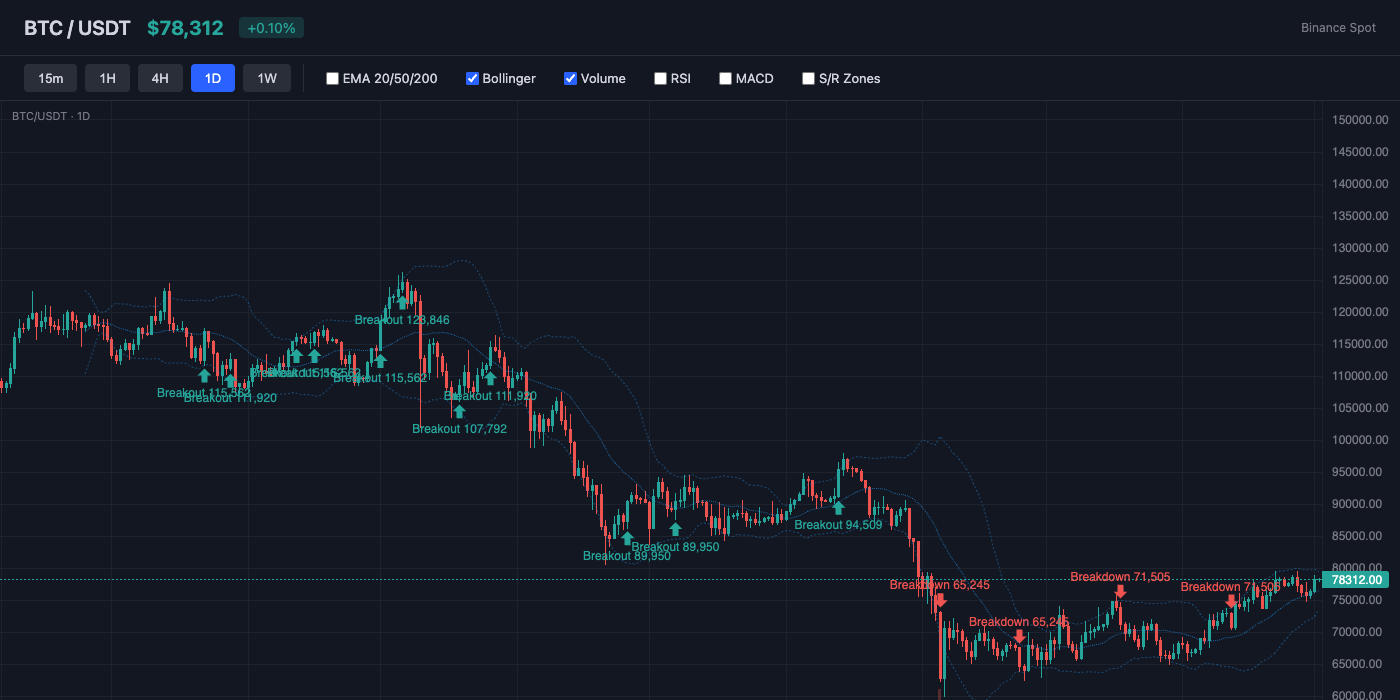
Bollinger Bands show a bandwidth of 9.1% (moderate volatility). Price is near the middle of the bands (%B: 76%), showing balanced positioning. The middle band (SMA 20) at $76,509 acts as dynamic support.
Momentum Indicators
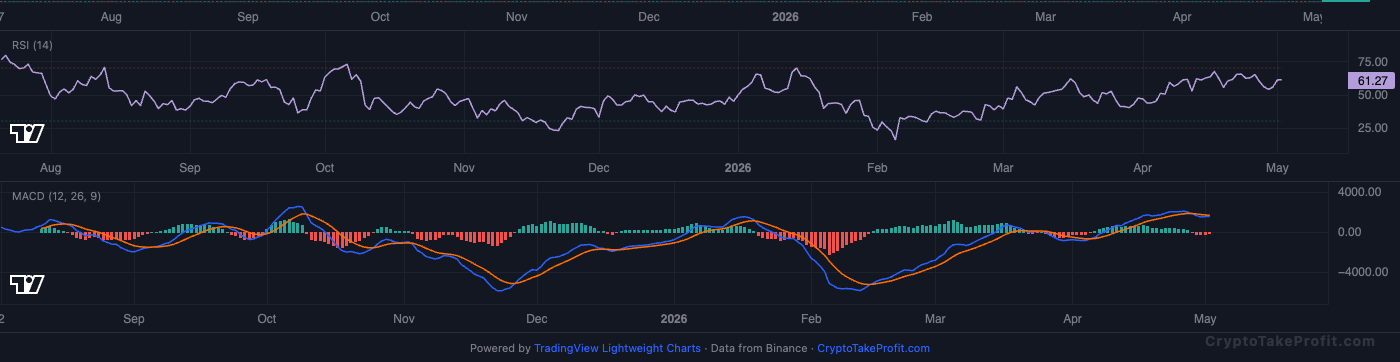
RSI reads 61.1, leaning bullish with room to run before reaching overbought. MACD has no active crossover, with negative histogram (-126.51) indicating downward pressure.
Market Structure
BTC is trading at $78,348 with a weak bearish bias.
Volume Analysis
Volume is at 0.48x the 20-day average, indicating low activity.
Key Levels
| Price | Type | Source | Significance | Distance |
|---|---|---|---|---|
| $83,826 | Resistance | Pivot R3 | Low | +7.0% |
| $81,368 | Resistance | Pivot R2 | Medium | +3.9% |
| $79,858 | Resistance | Pivot R1 | Medium | +1.9% |
| $78,348 | Current | — | — | — |
| $75,890 | Support | Pivot S1 | Medium | -3.1% |
| $73,432 | Support | Pivot S2 | Medium | -6.3% |
| $71,922 | Support | Pivot S3 | Low | -8.2% |
Moving Averages
| MA | Value | Position | Signal |
|---|---|---|---|
| EMA 20 | $75,682 | Above | Bullish |
| EMA 50 | $74,003 | Above | Bullish |
| EMA 200 | $84,545 | Below | Bearish |
| BB Middle (SMA 20) | $76,509 | Above | Bullish |
Trade Setup
BTC Scenario Analysis
Bullish Case
Trigger: N/A
Target: N/A
Invalidation: N/A
Base Case
Trigger: N/A
Target: N/A
Invalidation: N/A
Bearish Case
Trigger: N/A
Target: N/A
Invalidation: N/A
Bitcoin (BTC) Resources
Altcoin Overview
Among altcoins, ETH leads with the strongest bullish signal (score: 5), while SOL shows the weakest setup (score: -40). Traders should focus on coins with clear directional signals and volume confirmation.
What to Watch
- BTC $78,348: watch RSI 61.1 rejection or breakout above 65 momentum zone.
- ETH $2,305: monitor Doji pattern resolution near RSI 53.4 midline compression.
- SOL $83.83: key risk if RSI 46.8 drops below 45 support momentum band.
- BNB $616.30: bearish pressure persists with RSI 46.3 and -30 score structure.
- AVAX $9.11: downside bias remains with RSI 46.2, no reversal pattern confirmation.


