BTC at $79,940 — Daily Crypto Technical Analysis (May 4, 2026)
BTC at $79,940 (neutral) with chart analysis, futures data, and scenario breakdown. ETH, SOL, and top altcoins analyzed.
Market Overview
BTC at $79,940 is the strongest signal in the current watchlist, posting a conflicted neutral score of 23 with RSI at 65.5 — elevated but not yet overbought. Market cap and dominance data are unavailable, making directional reads on altcoin rotation unreliable. Fear & Greed is offline. Of the seven tracked coins, four score bearish or weak bearish as of May 4, 2026, with SOL, BNB, and AVAX all at RSI 50, signaling stalled momentum rather than reversal.
Bitcoin (BTC) — $79,940
● CONFLICTED NEUTRAL (Score: 23)
Price Action & Key Levels
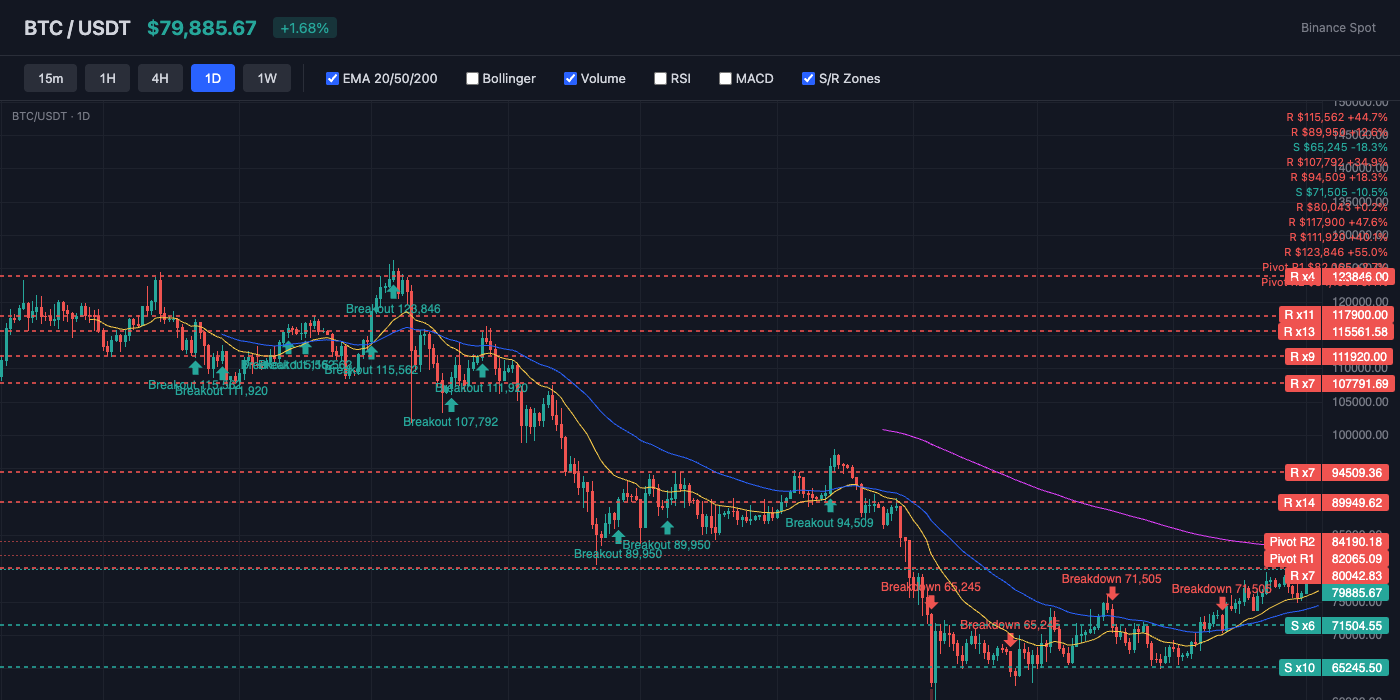
Bitcoin trades at $79,940, currently above the 20-day EMA ($76,402) and above the 50-day EMA ($74,417). The 200-day EMA at $84,489 serves as long-term resistance. Key resistance sits at $80,191 (BB Upper), while support holds at $76,378 (Pivot S1). EMA alignment is mixed, suggesting a transitional or ranging market.
Bollinger Bands & Volatility
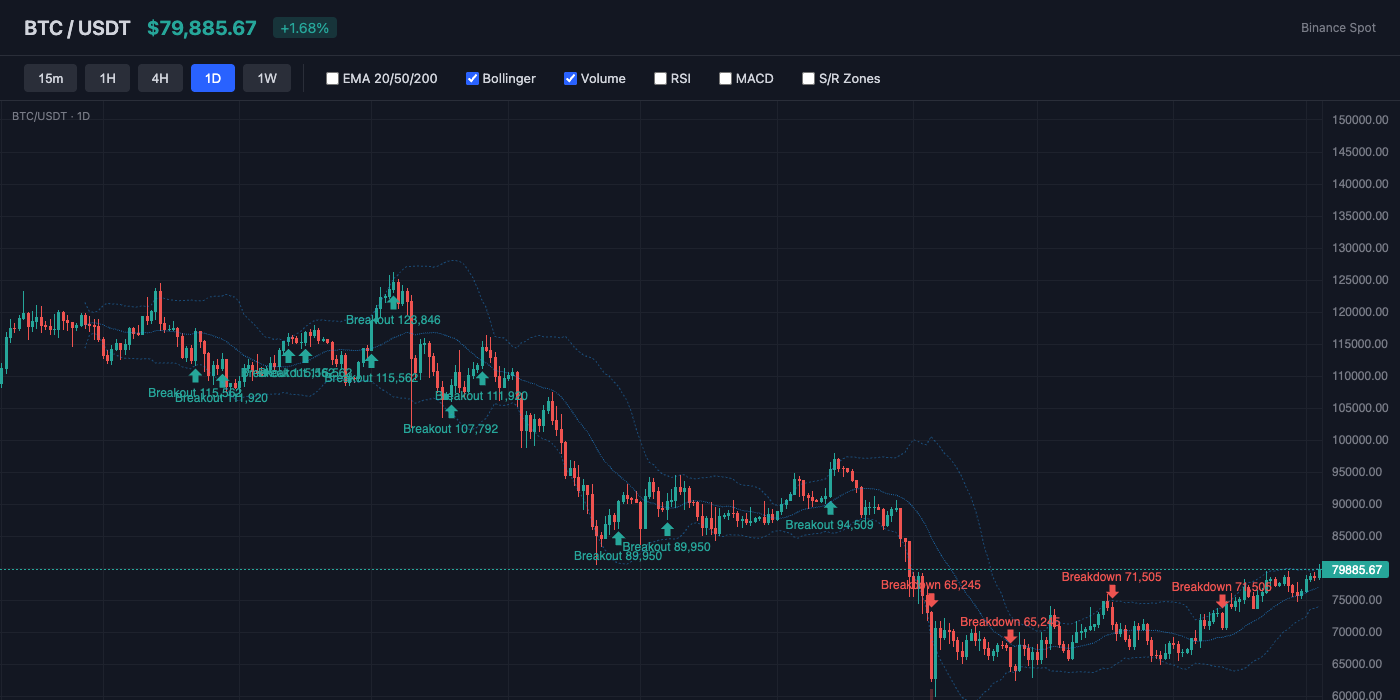
Bollinger Bands show a bandwidth of 8.1% (moderate volatility). Price sits near the upper band (%B: 96%), suggesting overbought conditions or strong bullish momentum. The middle band (SMA 20) at $77,087 acts as dynamic support.
Momentum Indicators
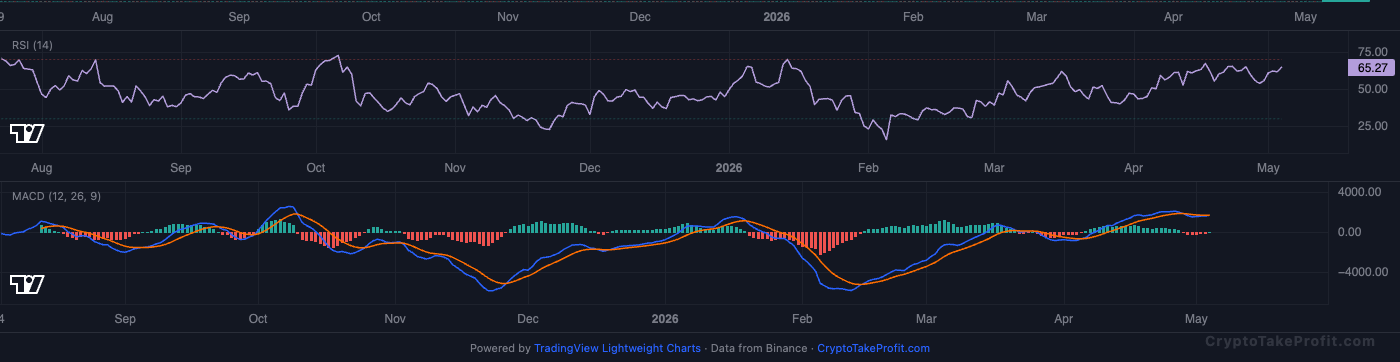
RSI reads 65.5, leaning bullish with room to run before reaching overbought. MACD shows a fresh bullish crossover, with positive histogram (10.48) indicating upward momentum.
Market Structure
BTC sits at $79,940 with BB %B at 96.0%, placing price near the upper Bollinger band resistance at $80,191. ATR at $2,177 shows elevated intraday movement, while structure remains range-compressed between $76,378 support and $80,191 resistance. Long/short ratio at 0.80 and funding at 0.0006% show mild short bias despite price holding near highs.
Volume Analysis
Volume ratio at 0.67x average confirms participation is below trend-confirmation levels. Price pushing toward $80,000 without expanding volume signals weakening conviction at resistance. Open interest at 107,969 contracts shows leveraged positioning is elevated, raising sensitivity to liquidation-driven moves.
Key Levels
| Price | Type | Source | Significance | Distance |
|---|---|---|---|---|
| $87,752 | Resistance | Pivot R3 | Low | +9.8% |
| $84,190 | Resistance | Pivot R2 | Medium | +5.3% |
| $82,065 | Resistance | Pivot R1 | Medium | +2.7% |
| $80,191 | Resistance | BB Upper | Low | +0.3% |
| $79,940 | Current | — | — | — |
| $76,378 | Support | Pivot S1 | Medium | -4.5% |
| $73,983 | Support | BB Lower | Low | -7.5% |
| $72,817 | Support | Pivot S2 | Medium | -8.9% |
| $70,692 | Support | Pivot S3 | Low | -11.6% |
Moving Averages
| MA | Value | Position | Signal |
|---|---|---|---|
| EMA 20 | $76,402 | Above | Bullish |
| EMA 50 | $74,417 | Above | Bullish |
| EMA 200 | $84,489 | Below | Bearish |
| BB Middle (SMA 20) | $77,087 | Above | Bullish |
Trade Setup
BTC Scenario Analysis
Bullish Case
Trigger: N/A
Target: N/A
Invalidation: N/A
Base Case
Trigger: N/A
Target: N/A
Invalidation: N/A
Bearish Case
Trigger: breakdown below $76,378 Pivot S1
Target: $74,200
Invalidation: $80,191 resistance reclaim
Bitcoin (BTC) Resources
Altcoin Overview
Among altcoins, ADA leads with the strongest bullish signal (score: 20), while AVAX shows the weakest setup (score: -5). Traders should focus on coins with clear directional signals and volume confirmation.
What to Watch
- BTC $79,940: RSI 65.5 approaching overbought — watch $80,500 as first resistance.
- ADA $0.2530: Highest bullish score (20) in the set; $0.27 is the key breakout level.
- ETH $2,371: Neutral score 0, RSI 59.2 — needs a close above $2,400 to shift bias.
- SOL $84.92: RSI exactly 50.0 — a drop below $83 would confirm bearish score of -5.
- AVAX $9.27: Weakest price in the list with RSI 50.3; $9.00 is critical support to hold.


