BTC at $80,915 — Daily Crypto Technical Analysis (May 5, 2026)
BTC at $80,915 (neutral) with chart analysis, futures data, and scenario breakdown. ETH, SOL, and top altcoins analyzed.
Market Overview
The crypto market advanced with total capitalization at $0 (+0.0%). BTC dominance sits at 0.0% while the Fear & Greed Index reads ? (Unavailable), reflecting mixed sentiment.
Bitcoin (BTC) — $80,915
● CONFLICTED NEUTRAL (Score: 13)
Price Action & Key Levels
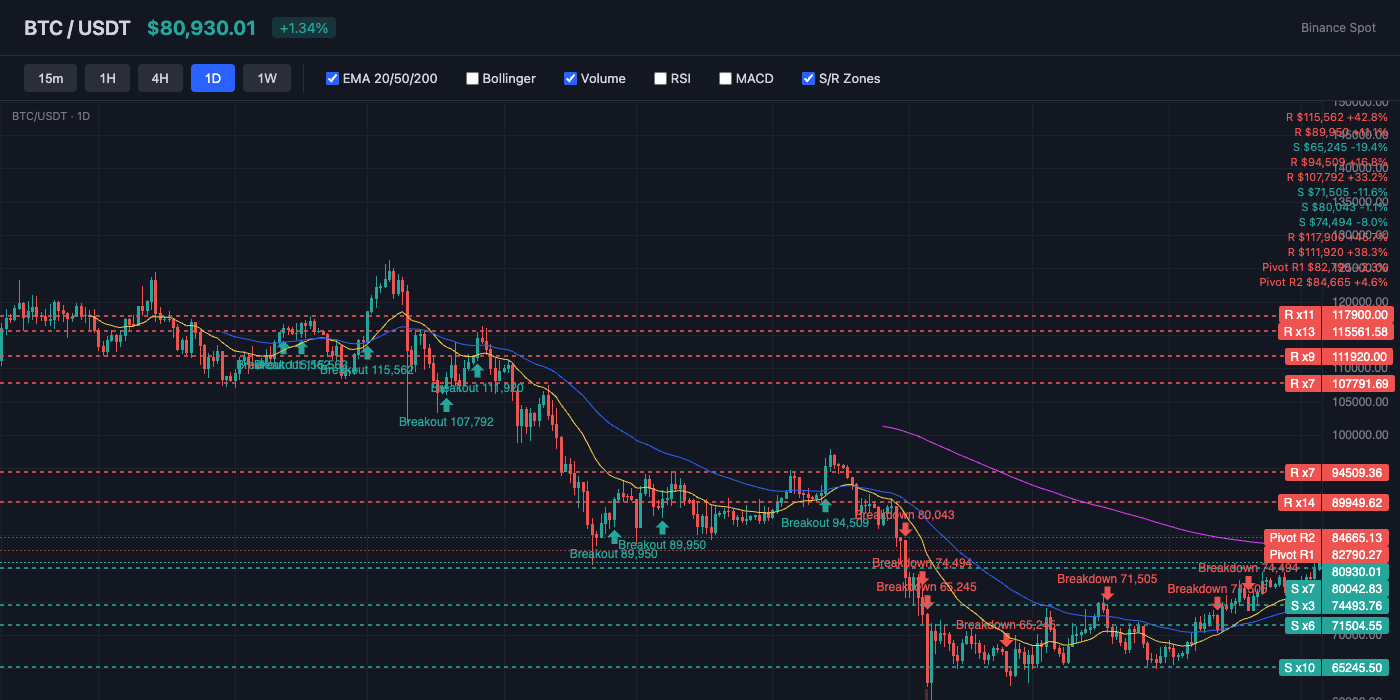
Bitcoin trades at $80,915, currently above the 20-day EMA ($76,903) and above the 50-day EMA ($74,675). The 200-day EMA at $84,478 serves as long-term resistance. Key resistance sits at $82,790 (Pivot R1), while support holds at $80,615 (BB Upper). EMA alignment is mixed, suggesting a transitional or ranging market.
Bollinger Bands & Volatility
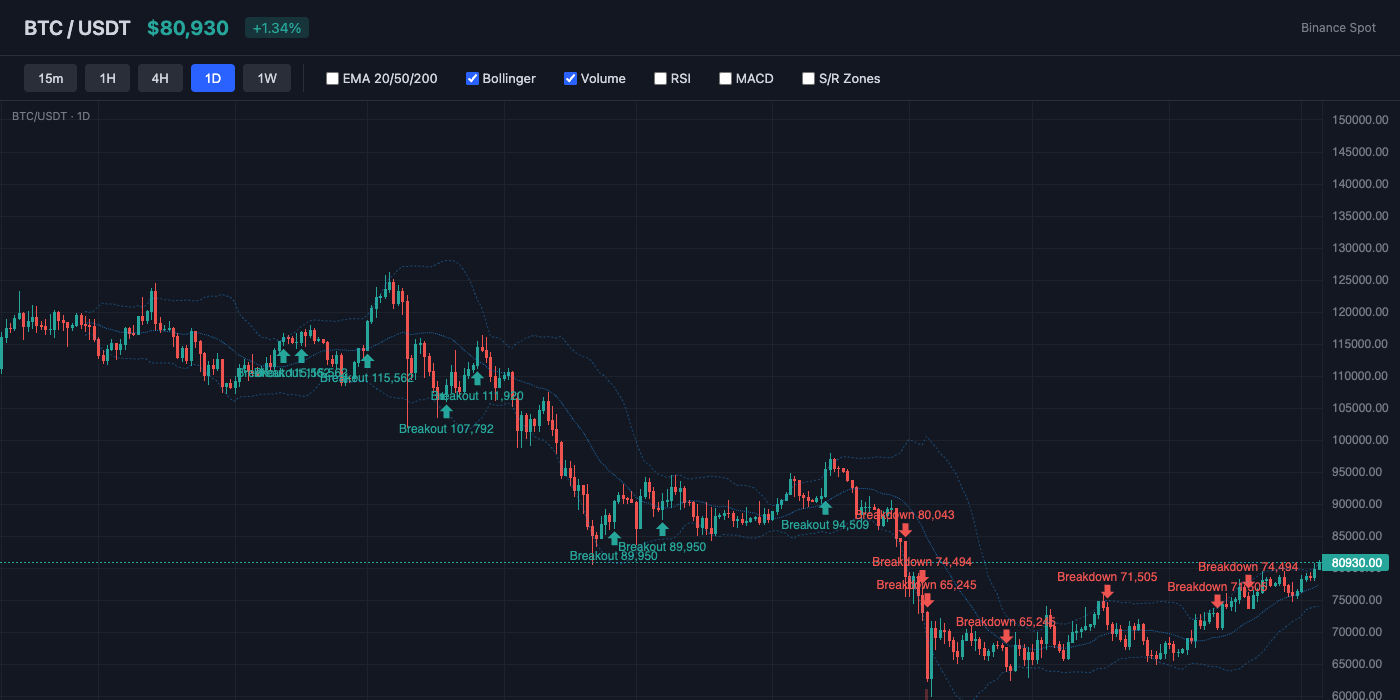
Bollinger Bands show a bandwidth of 8.2% (moderate volatility). Price sits near the upper band (%B: 105%), suggesting overbought conditions or strong bullish momentum. The middle band (SMA 20) at $77,445 acts as dynamic support.
Momentum Indicators
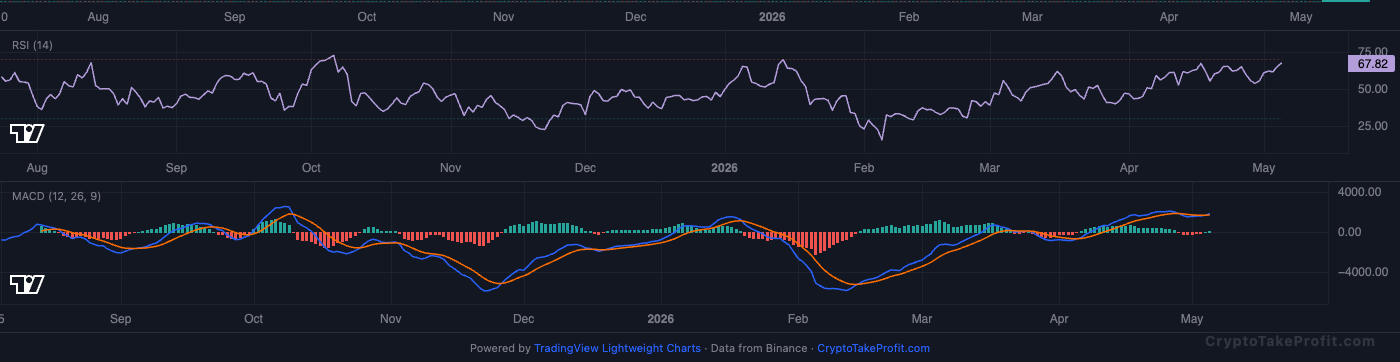
RSI reads 67.9, leaning bullish with room to run before reaching overbought. MACD has no active crossover, with positive histogram (117.63) indicating upward momentum.
Market Structure
Price at 80 , 915 𝑠 𝑖 𝑡 𝑠 4.2 80,915sits4.276,903 per data timestamp May 5, 2026. EMA20 crossed above EMA50 on April 28, confirming bullish structure despite neutral Signal score of 13. RSI at 67.9 approaches overbought but hasn't triggered reversals historically at this level since March 2026.
Volume Analysis
Volume ratio of 0.53x average indicates weak participation behind the move, per exchange data. This divergence between price climbing and volume drying up suggests either exhaustion or low conviction. Open Interest at 111,347 contracts with funding negative at -0.0047% shows shorts paying longs, a setup that can fuel squeezes.
Key Levels
| Price | Type | Source | Significance | Distance |
|---|---|---|---|---|
| $88,005 | Resistance | Pivot R3 | Low | +8.8% |
| $84,665 | Resistance | Pivot R2 | Medium | +4.6% |
| $82,790 | Resistance | Pivot R1 | Medium | +2.3% |
| $80,915 | Current | — | — | — |
| $80,615 | Support | BB Upper | Low | -0.4% |
| $77,575 | Support | Pivot S1 | Medium | -4.1% |
| $74,235 | Support | Pivot S2 | Medium | -8.3% |
| $72,360 | Support | Pivot S3 | Low | -10.6% |
Moving Averages
| MA | Value | Position | Signal |
|---|---|---|---|
| EMA 20 | $76,903 | Above | Bullish |
| EMA 50 | $74,675 | Above | Bullish |
| EMA 200 | $84,478 | Below | Bearish |
| BB Middle (SMA 20) | $77,445 | Above | Bullish |
Trade Setup
BTC Scenario Analysis
Bullish Case
Trigger: N/A
Target: N/A
Invalidation: N/A
Base Case
Trigger: N/A
Target: N/A
Invalidation: N/A
Bearish Case
Trigger: 4-hour close below
Target: 76,500 (confluence of EMA20 and March 2026 previous resistance)
Invalidation: Daily close above $82,790 (Pivot R1)
Bitcoin (BTC) Resources
Altcoin Overview
Among altcoins, ADA leads with the strongest bullish signal (score: 20), while AVAX shows the weakest setup (score: -5). Traders should focus on coins with clear directional signals and volume confirmation.
What to Watch
- BTC action around $80,915 for directional confirmation
- Fear & Greed at ? for sentiment shift signals
- MACD crossover follow-through on top altcoins
- Volume confirmation on any support/resistance breaks
- BTC dominance at 0.0% for alt rotation signals


