BTC Holds $79,378 as Bulls Build Momentum — Daily TA Report
BTC at $79,378 (bullish) with chart analysis, futures data, and scenario breakdown. ETH, SOL, and top altcoins analyzed.
Market Overview
The crypto market pulled back with total capitalization at $2.73T (-2.2%). BTC dominance sits at 58.3% while the Fear & Greed Index reads 38 (Fear), reflecting cautious sentiment.
Bitcoin (BTC) — $79,378
▲ WEAK BULLISH (Score: 35)
Price Action & Key Levels
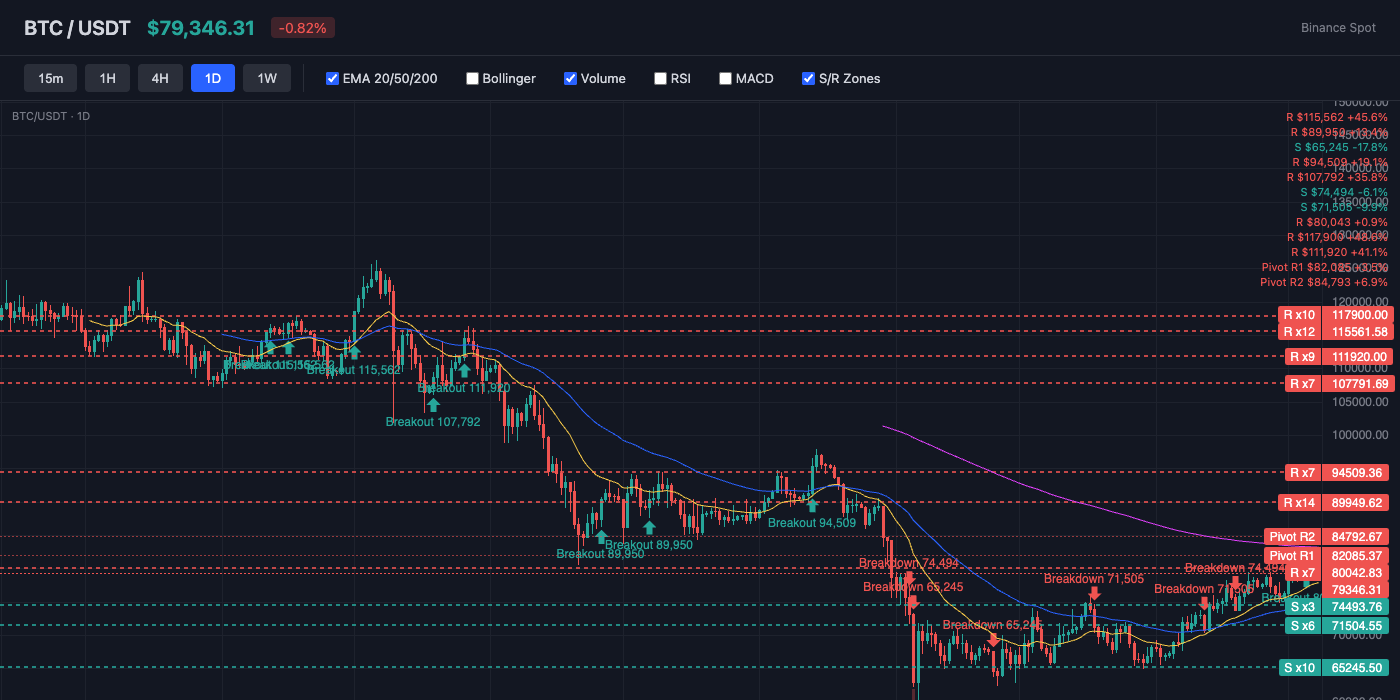
Bitcoin trades at $79,378, currently above the 20-day EMA ($77,970) and above the 50-day EMA ($75,332). The 200-day EMA at $84,396 serves as long-term resistance. Key resistance sits at $82,085 (Pivot R1), while support holds at $77,435 (Pivot S1). EMA alignment is mixed, suggesting a transitional or ranging market.
Bollinger Bands & Volatility
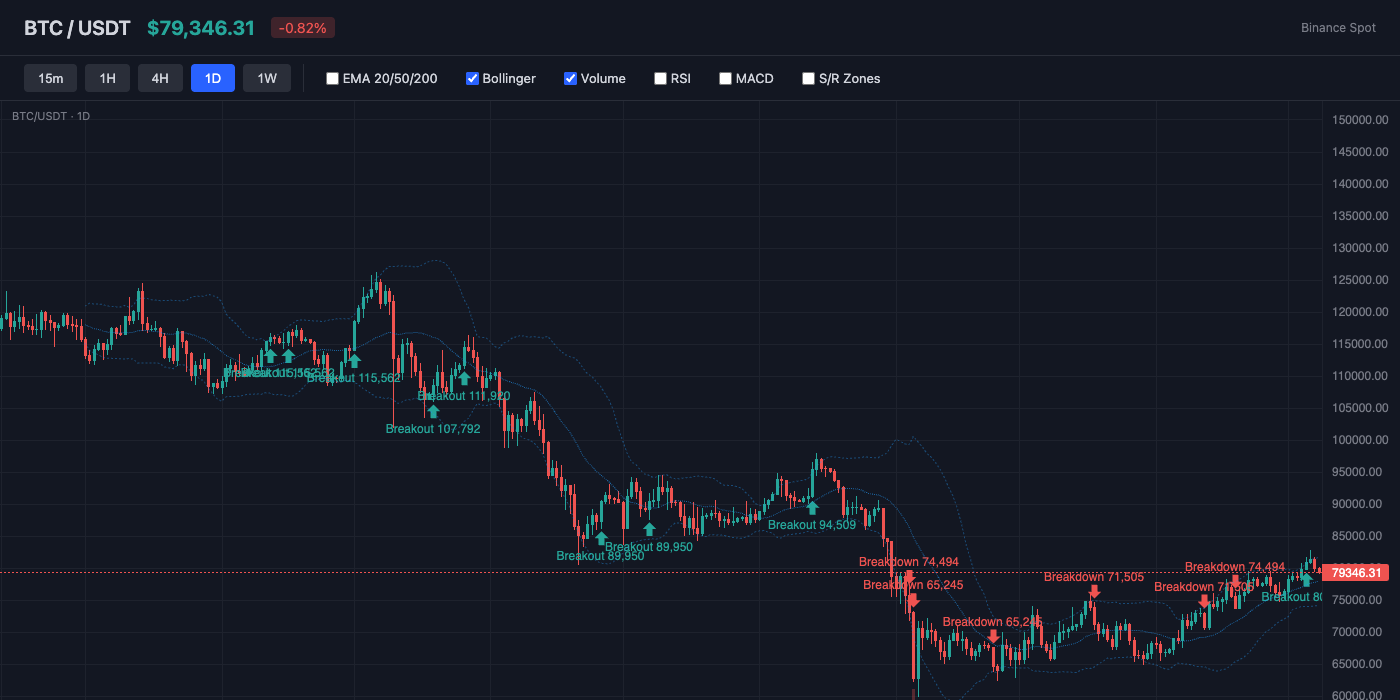
Bollinger Bands show a bandwidth of 9.2% (moderate volatility). Price is near the middle of the bands (%B: 68%), showing balanced positioning. The middle band (SMA 20) at $78,093 acts as dynamic support.
Momentum Indicators
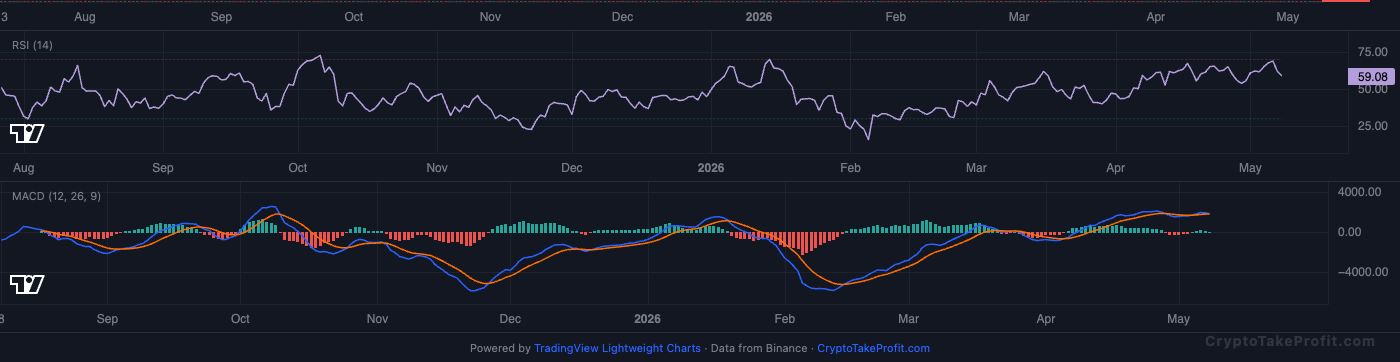
RSI reads 58.8, sitting in neutral range with no extreme readings. MACD has no active crossover, with positive histogram (18.26) indicating upward momentum.
Market Structure
BTC remains short-term bullish as of May 8, 2026 because price at $79,378 still trades above the EMA20 at $77,970 and EMA50 at $75,332. RSI at 58.8 and a positive MACD histogram show momentum still favors buyers, but the weak bullish signal score of 35 and Fear & Greed reading of 38 show conviction remains limited after the total crypto market cap fell 2.2% to $2.73T.
Volume Analysis
Volume does not confirm a breakout yet. BTC volume sits at 0.48x average, which means the move above the EMA20 lacks aggressive spot participation despite open interest remaining elevated at 103,536 contracts and funding rates staying slightly positive at 0.0013%. The long/short ratio at 0.70 shows traders still lean net short, which can fuel squeezes higher if resistance breaks.
Key Levels
| Price | Type | Source | Significance | Distance |
|---|---|---|---|---|
| $86,735 | Resistance | Pivot R3 | Low | +9.3% |
| $84,793 | Resistance | Pivot R2 | Medium | +6.8% |
| $82,085 | Resistance | Pivot R1 | Medium | +3.4% |
| $79,378 | Current | — | — | — |
| $77,435 | Support | Pivot S1 | Medium | -2.4% |
| $75,493 | Support | Pivot S2 | Medium | -4.9% |
| $74,485 | Support | BB Lower | Low | -6.2% |
| $72,785 | Support | Pivot S3 | Low | -8.3% |
Moving Averages
| MA | Value | Position | Signal |
|---|---|---|---|
| EMA 20 | $77,970 | Above | Bullish |
| EMA 50 | $75,332 | Above | Bullish |
| EMA 200 | $84,396 | Below | Bearish |
| BB Middle (SMA 20) | $78,093 | Above | Bullish |
Trade Setup
BTC Scenario Analysis
Bullish Case
Trigger: Daily close above $82,085 with volume expanding above 1.0x average
Target: $84,800 initially, then $87,200 if shorts unwind
Invalidation: Daily close below $77,435
Base Case
Trigger: BTC remains between $77,435 and $82,085 over the next 5-7 days
Target: Range rotation around $80,000 midpoint
Invalidation: Breakout above $82,085 or breakdown below $77,435 with strong volume
Bearish Case
Trigger: Loss of $77,435 support with rising sell volume above 1.2x average
Target: $75,332 EMA50 first, then $72,900
Invalidation: Reclaim of $79,500 with positive funding expansion
Bitcoin (BTC) Resources
Altcoin Overview
Among altcoins, BNB leads with the strongest bullish signal (score: 25), while XRP shows the weakest setup (score: -35). Traders should focus on coins with clear directional signals and volume confirmation.
What to Watch
- BTC action around $79,378 for directional confirmation
- Fear & Greed at 38 for sentiment shift signals
- MACD crossover follow-through on top altcoins
- Volume confirmation on any support/resistance breaks
- BTC dominance at 58.3% for alt rotation signals


