BTC at $80,191 — Daily Crypto Technical Analysis (May 9, 2026)
BTC at $80,191 (neutral) with chart analysis, futures data, and scenario breakdown. ETH, SOL, and top altcoins analyzed.
Market Overview
The crypto market advanced with total capitalization at $2.76T (+1.2%). BTC dominance sits at 58.1% while the Fear & Greed Index reads 38 (Fear), reflecting cautious sentiment.
Bitcoin (BTC) — $80,191
● CONFLICTED NEUTRAL (Score: 13)
Price Action & Key Levels
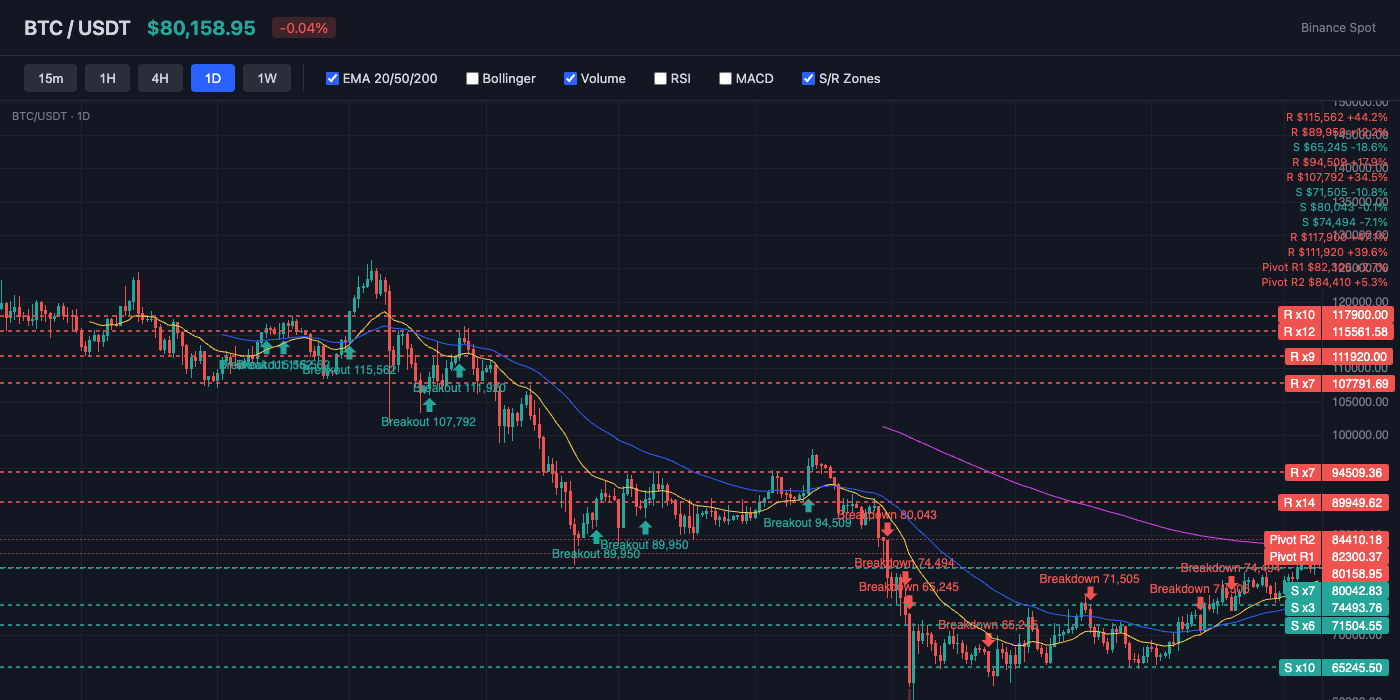
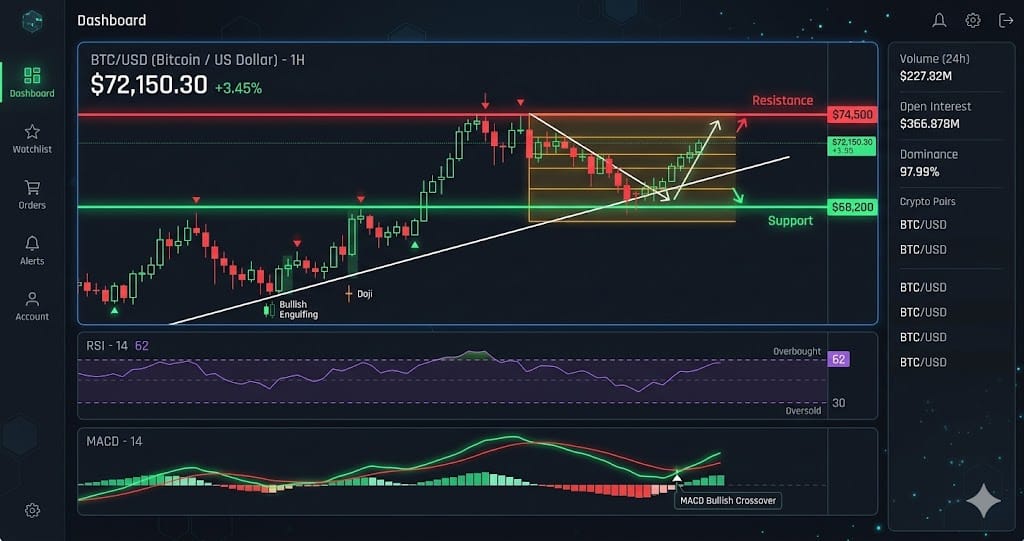
Bitcoin trades at $80,191, currently above the 20-day EMA ($78,302) and above the 50-day EMA ($75,552). The 200-day EMA at $84,372 serves as long-term resistance. Key resistance sits at $82,300 (Pivot R1), while support holds at $78,630 (Pivot S1). EMA alignment is mixed, suggesting a transitional or ranging market.
Bollinger Bands & Volatility
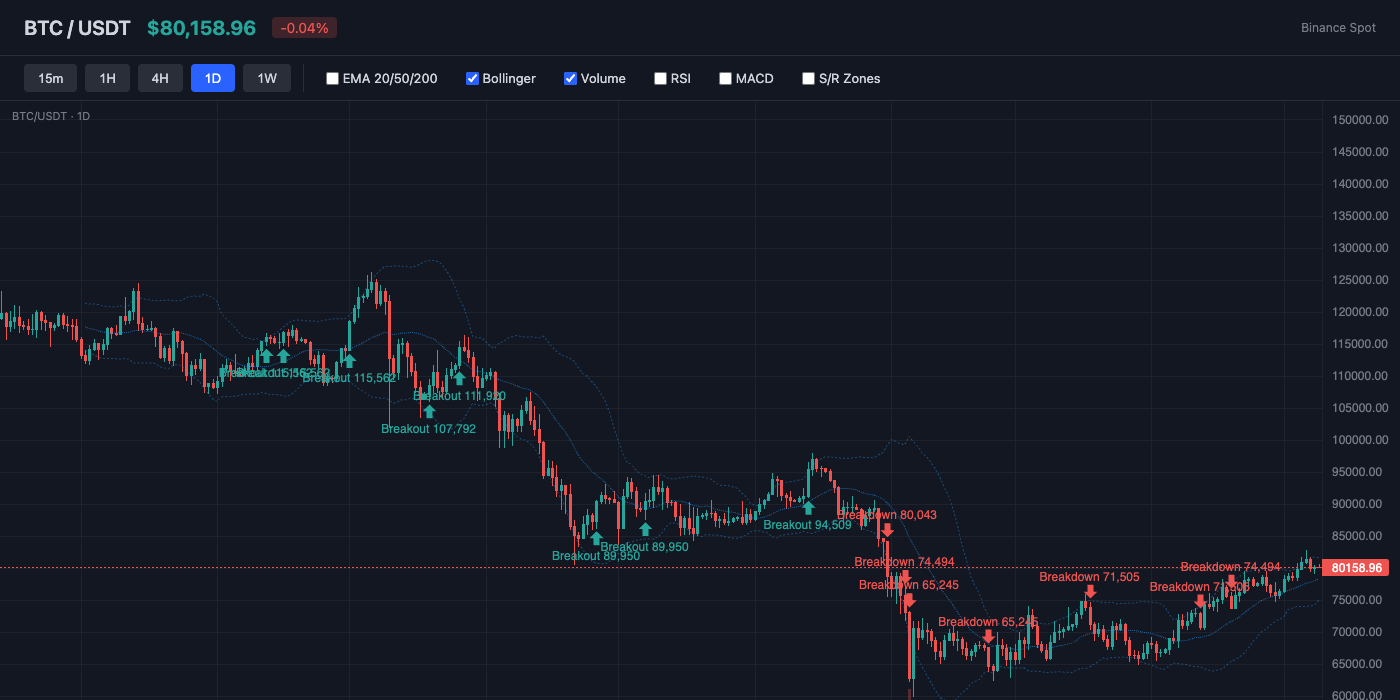
Bollinger Bands show a bandwidth of 9.3% (moderate volatility). Price is near the middle of the bands (%B: 75%), showing balanced positioning. The middle band (SMA 20) at $78,349 acts as dynamic support.
Momentum Indicators
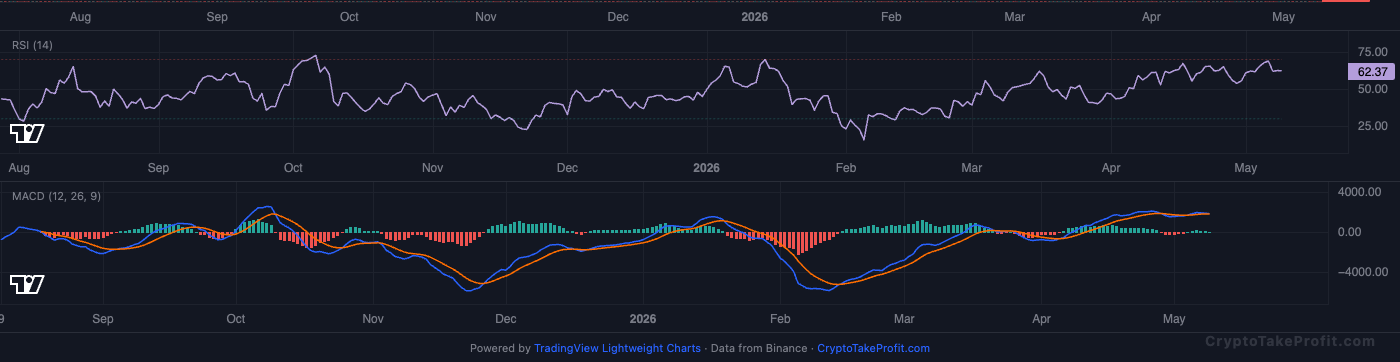
RSI reads 61.9, leaning bullish with room to run before reaching overbought. MACD has no active crossover, with positive histogram (6.67) indicating upward momentum.
Market Structure
Price at 80 , 191 𝑠 𝑖 𝑡 𝑠 0.5 80,191sits0.582,300 and 1.7% above support at $78,630 per Binance data as of May 9, 2026. A Doji candle closed on 4-hour timeframe, signaling indecision. Funding rate at -0.0047% and Long/Short ratio at 0.70 show bearish positioning despite price holding above EMAs.
Volume Analysis
Volume ratio at 0.36x average, according to CoinMarketCap 24h data. Low participation confirms the Doji's indecision. Per Coinglass data, Open Interest held steady at 101,195 contracts, meaning sidelined capital waits for a breakout.
Key Levels
| Price | Type | Source | Significance | Distance |
|---|---|---|---|---|
| $85,970 | Resistance | Pivot R3 | Low | +7.2% |
| $84,410 | Resistance | Pivot R2 | Medium | +5.3% |
| $82,300 | Resistance | Pivot R1 | Medium | +2.6% |
| $80,191 | Current | — | — | — |
| $78,630 | Support | Pivot S1 | Medium | -1.9% |
| $77,070 | Support | Pivot S2 | Medium | -3.9% |
| $74,960 | Support | Pivot S3 | Low | -6.5% |
Moving Averages
| MA | Value | Position | Signal |
|---|---|---|---|
| EMA 20 | $78,302 | Above | Bullish |
| EMA 50 | $75,552 | Above | Bullish |
| EMA 200 | $84,372 | Below | Bearish |
| BB Middle (SMA 20) | $78,349 | Above | Bullish |
Trade Setup
BTC Scenario Analysis
Bullish Case
Trigger: Break above
Target: 87,200
Invalidation: Close below
Base Case
Trigger: Price stays between
Target: 78
Invalidation: 4-hour close below
Bearish Case
Trigger: Close below
Target: 74,800 (200 EMA)
Invalidation: 4-hour close above 82,300 Fear & Greed at 38 and Long/Short ratio at 0.70 show retail fear despite price at 80,191. A break below
Bitcoin (BTC) Resources
Altcoin Overview
Among altcoins, XRP leads with the strongest bullish signal (score: 40), while ETH shows the weakest setup (score: -20). Traders should focus on coins with clear directional signals and volume confirmation.
What to Watch
- BTC action around $80,191 for directional confirmation
- Fear & Greed at 38 for sentiment shift signals
- MACD crossover follow-through on top altcoins
- Volume confirmation on any support/resistance breaks
- BTC dominance at 58.1% for alt rotation signals


