BTC at $81,043 — Daily Crypto Technical Analysis (May 12, 2026)
BTC at $81,043 (bearish) with chart analysis, futures data, and scenario breakdown. ETH, SOL, and top altcoins analyzed.
Market Overview
The crypto market advanced with total capitalization at $2.79T (+0.2%). BTC dominance sits at 58.2% while the Fear & Greed Index reads 49 (Neutral), reflecting mixed sentiment.
Bitcoin (BTC) — $81,043
▼ WEAK BEARISH (Score: -22)
Price Action & Key Levels
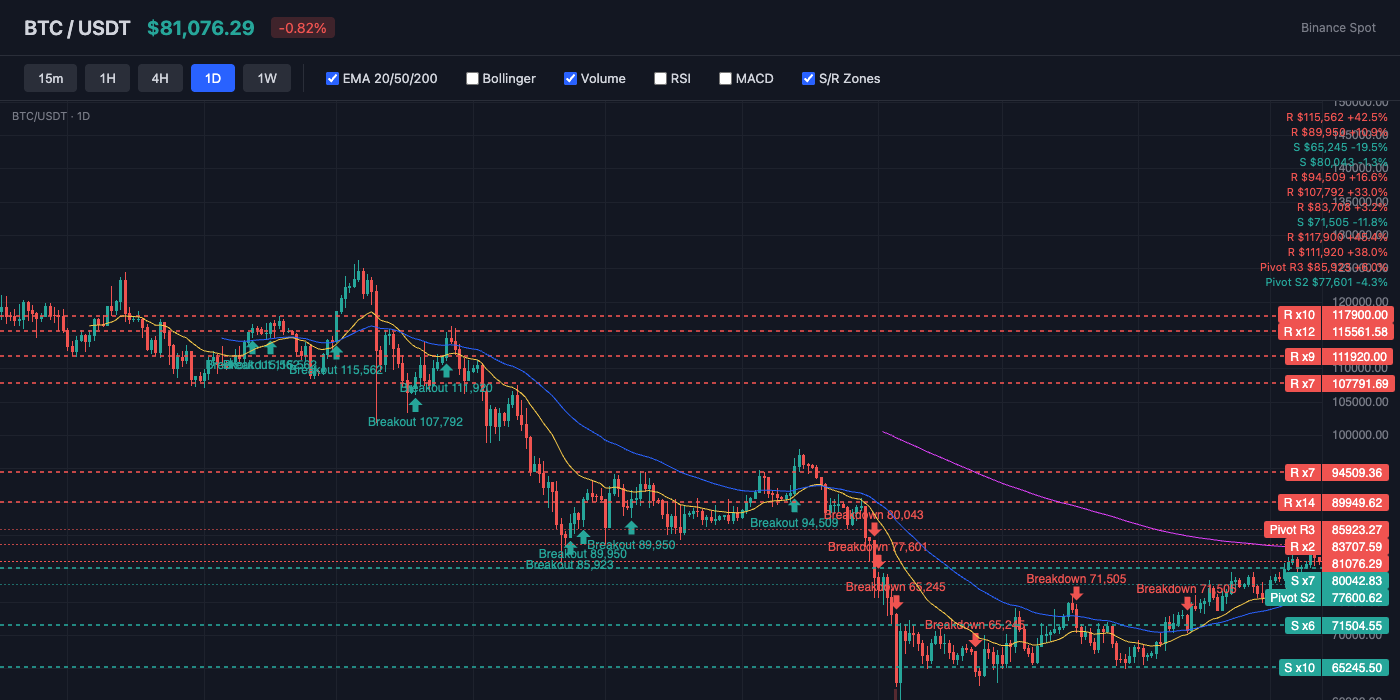
Bitcoin trades at $81,043, currently above the 20-day EMA ($79,205) and above the 50-day EMA ($76,213). The 200-day EMA at $84,336 serves as long-term resistance. Key resistance sits at $82,623 (Pivot R1), while support holds at $79,322 (Pivot S1). EMA alignment is mixed, suggesting a transitional or ranging market.
Bollinger Bands & Volatility
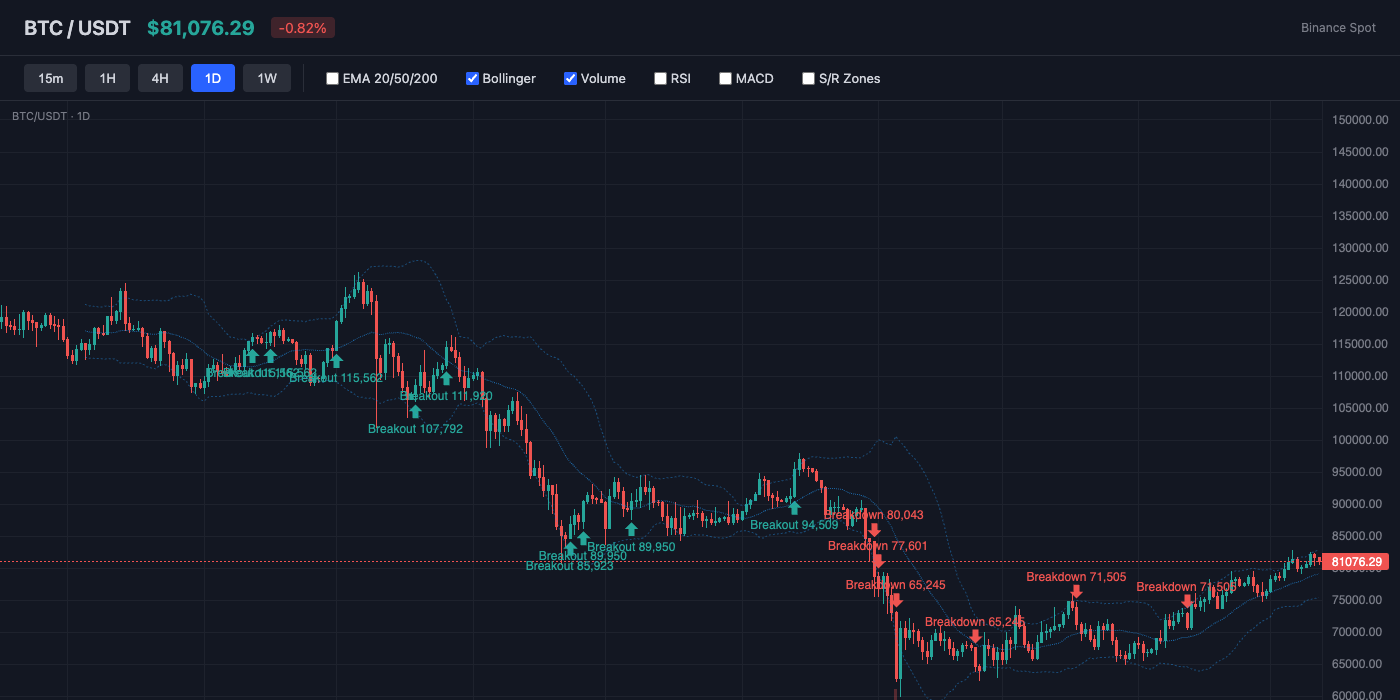
Bollinger Bands show a bandwidth of 9.5% (moderate volatility). Price is near the middle of the bands (%B: 77%), showing balanced positioning. The middle band (SMA 20) at $79,020 acts as dynamic support.
Momentum Indicators
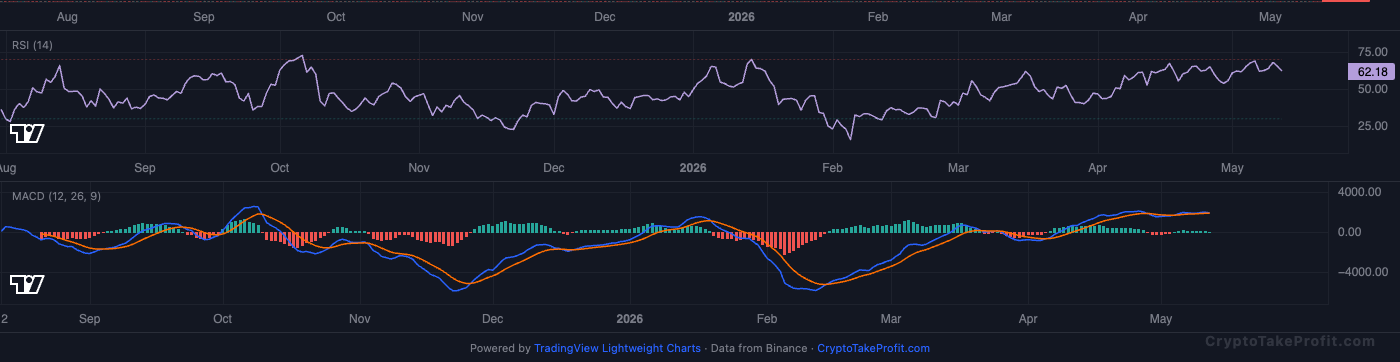
RSI reads 63.2, leaning bullish with room to run before reaching overbought. MACD shows a bearish crossover, with negative histogram (-17.41) indicating downward pressure.
Market Structure
BTC is trading at $81,043 with a weak bearish bias.
Volume Analysis
Volume is at 0.72x the 20-day average, indicating normal activity.
Key Levels
| Price | Type | Source | Significance | Distance |
|---|---|---|---|---|
| $85,923 | Resistance | Pivot R3 | Low | +6.0% |
| $84,202 | Resistance | Pivot R2 | Medium | +3.9% |
| $82,623 | Resistance | Pivot R1 | Medium | +1.9% |
| $81,043 | Current | — | — | — |
| $79,322 | Support | Pivot S1 | Medium | -2.1% |
| $77,601 | Support | Pivot S2 | Medium | -4.2% |
| $76,021 | Support | Pivot S3 | Low | -6.2% |
Moving Averages
| MA | Value | Position | Signal |
|---|---|---|---|
| EMA 20 | $79,205 | Above | Bullish |
| EMA 50 | $76,213 | Above | Bullish |
| EMA 200 | $84,336 | Below | Bearish |
| BB Middle (SMA 20) | $79,020 | Above | Bullish |
Trade Setup
BTC Scenario Analysis
Bullish Case
Trigger: N/A
Target: N/A
Invalidation: N/A
Base Case
Trigger: N/A
Target: N/A
Invalidation: N/A
Bearish Case
Trigger: N/A
Target: N/A
Invalidation: N/A
Bitcoin (BTC) Resources
Altcoin Overview
Among altcoins, XRP leads with the strongest bullish signal (score: 30), while ETH shows the weakest setup (score: -25). Traders should focus on coins with clear directional signals and volume confirmation.
What to Watch
- BTC action around $81,043 for directional confirmation
- Fear & Greed at 49 for sentiment shift signals
- MACD crossover follow-through on top altcoins
- Volume confirmation on any support/resistance breaks
- BTC dominance at 58.2% for alt rotation signals


