BTC at $79,761 — Daily Crypto Technical Analysis (May 14, 2026)
BTC at $79,761 (bullish) with chart analysis, futures data, and scenario breakdown. ETH, SOL, and top altcoins analyzed.
Market Overview
The crypto market pulled back with total capitalization at $2.74T (-1.5%). BTC dominance sits at 58.2% while the Fear & Greed Index reads 34 (Fear), reflecting cautious sentiment.
Bitcoin (BTC) — $79,761
▲ WEAK BULLISH (Score: 15)
Price Action & Key Levels
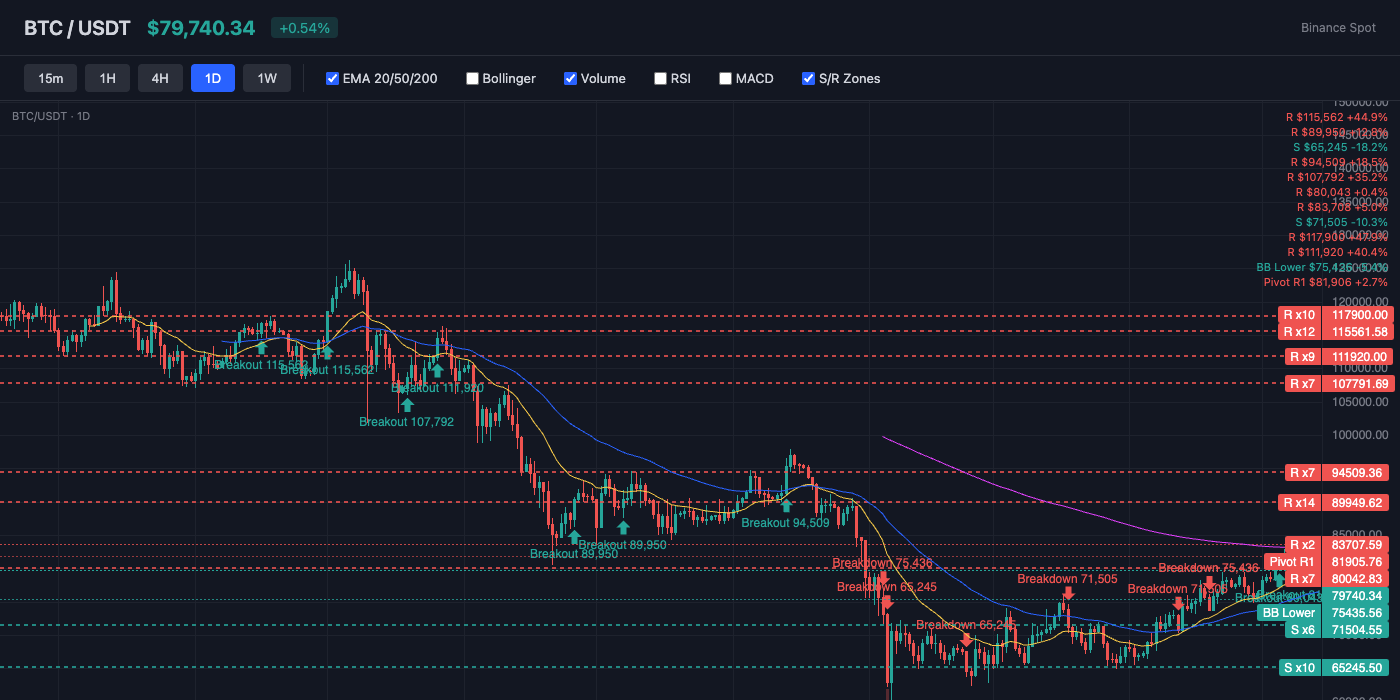
Bitcoin trades at $79,761, currently above the 20-day EMA ($79,192) and above the 50-day EMA ($76,426). The 200-day EMA at $84,269 serves as long-term resistance. Key resistance sits at $81,906 (Pivot R1), while support holds at $79,192 (EMA20). EMA alignment is mixed, suggesting a transitional or ranging market.
Bollinger Bands & Volatility
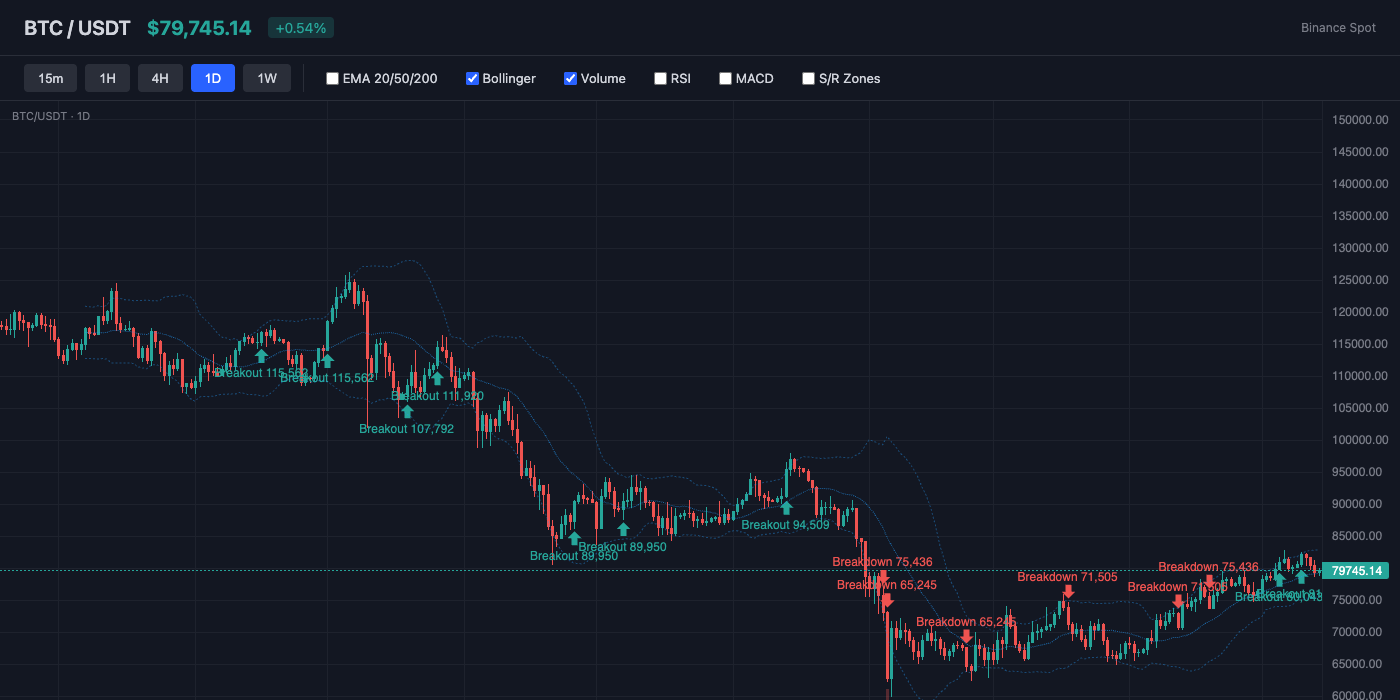
Bollinger Bands show a bandwidth of 9.2% (moderate volatility). Price is near the middle of the bands (%B: 59%), showing balanced positioning. The middle band (SMA 20) at $79,093 acts as dynamic support.
Momentum Indicators
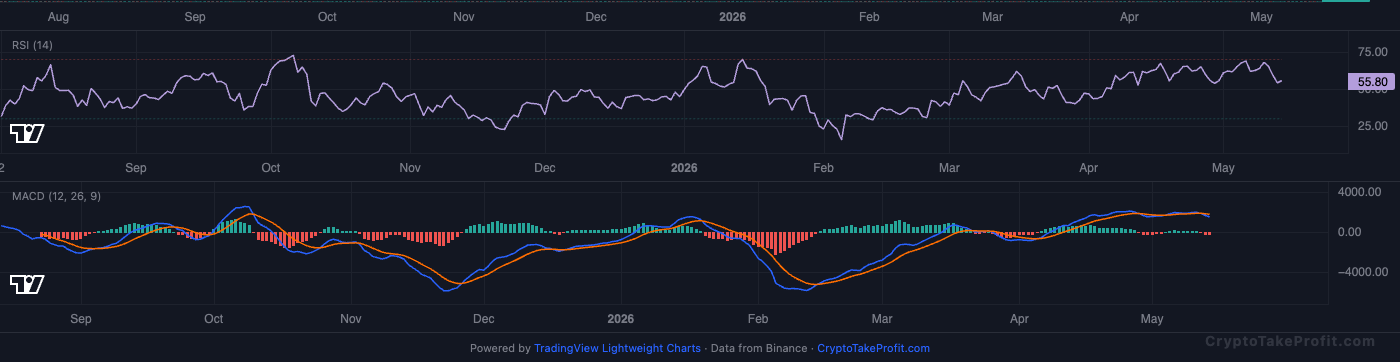
RSI reads 56.2, sitting in neutral range with no extreme readings. MACD has no active crossover, with negative histogram (-282.74) indicating downward pressure.
Market Structure
Price at 79 , 761 𝑠 𝑖 𝑡 𝑠 𝑗 𝑢 𝑠 𝑡 0.7 79,761sitsjust0.779,192. EMA50 at $76,426 provides the next structural floor, a 4.2% drop. The Hammer pattern on daily candles suggests rejected lows, but Fear & Greed at 34 contradicts bullish conviction.
Volume Analysis
Volume ratio at 0.56x average means today's trading is half normal activity. Low volume on a Hammer pattern weakens the reversal signal. Per Binance data, weak participation typically precedes false breaks in either direction.
Key Levels
| Price | Type | Source | Significance | Distance |
|---|---|---|---|---|
| $85,620 | Resistance | Pivot R3 | Low | +7.3% |
| $84,050 | Resistance | Pivot R2 | Medium | +5.4% |
| $82,751 | Resistance | BB Upper | Low | +3.7% |
| $81,906 | Resistance | Pivot R1 | Medium | +2.7% |
| $79,761 | Current | — | — | — |
| $79,192 | Support | EMA20 | Low | -0.7% |
| $78,192 | Support | Pivot S1 | Medium | -2.0% |
| $76,622 | Support | Pivot S2 | Medium | -3.9% |
| $75,436 | Support | BB Lower | Low | -5.4% |
Moving Averages
| MA | Value | Position | Signal |
|---|---|---|---|
| EMA 20 | $79,192 | Above | Bullish |
| EMA 50 | $76,426 | Above | Bullish |
| EMA 200 | $84,269 | Below | Bearish |
| BB Middle (SMA 20) | $79,093 | Above | Bullish |
Trade Setup
BTC Scenario Analysis
Bullish Case
Trigger: price holds above
Target: 84
Invalidation: priceclosesbelow78,500
Base Case
Trigger: price oscillates between
Target: 79
Invalidation: a 4-hour candle close above
Bearish Case
Trigger: price breaks below
Target: 76,426 (EMA50)
Invalidation: price reclaims
Bitcoin (BTC) Resources
Altcoin Overview
Among altcoins, XRP leads with the strongest bullish signal (score: 50), while ETH shows the weakest setup (score: -15). Traders should focus on coins with clear directional signals and volume confirmation.
What to Watch
- BTC action around $79,761 for directional confirmation
- Fear & Greed at 34 for sentiment shift signals
- MACD crossover follow-through on top altcoins
- Volume confirmation on any support/resistance breaks
- BTC dominance at 58.2% for alt rotation signals


